UNITED STATES
SECURITIES AND EXCHANGE COMMISSION
WASHINGTON, D.C. 20549
FORM
(Mark One)
For the quarterly period ended
or
For the transition period from _____________ to ___________
Commission File Number
(Exact name of registrant as specified in its charter)
(State or other jurisdiction of incorporation or organization) |
(I.R.S. Employer Identification No.) |
(Address of principal executive offices) |
(Zip Code) |
(Registrant's telephone number, including area code)
Securities registered pursuant to Section 12(b) of the Act:
Title of each class |
|
Trading Symbol(s) |
|
Name of each exchange on which registered |
|
|
Indicate by check mark whether the registrant (1) has filed all reports required to be filed by Section 13 or 15(d) of the Securities Exchange Act of 1934 during the preceding 12 months (or for such shorter period that the registrant was required to file such reports), and (2) has been subject to such filing requirements for the past 90 days.
Indicate by check mark whether the registrant has submitted electronically every Interactive Data File required to be submitted pursuant to Rule 405 of Regulation S-T (§232.405 of this chapter) during the preceding 12 months (or for such shorter period that the registrant was required to submit such files).
Indicate by check mark whether the registrant is a large accelerated filer, an accelerated filer, a non-accelerated filer, a smaller reporting company, or an emerging growth company. See the definitions of "large accelerated filer," "accelerated filer," "smaller reporting company," and "emerging growth company" in Rule 12b-2 of the Exchange Act.
Large accelerated filer |
☐ |
|
☒ |
|
Non-accelerated filer |
☐ |
|
Smaller reporting company |
|
Emerging growth company |
|
|
|
|
If an emerging growth company, indicate by check mark if the registrant has elected not to use the extended transition period for complying with any new or revised financial accounting standards provided pursuant to Section 13(a) of the Exchange Act. ☐
Indicate by check mark whether the registrant is a shell company (as defined in Rule 12b-2 of the Exchange Act).
Yes ☐ No
As of November 3, 2023, there were outstanding
Graham Corporation and Subsidiaries
Index to Form 10-Q
As of September 30, 2023 and March 31, 2023 and for the three and six months ended September 30, 2023 and 2022
|
|
Page |
Part I. |
|
|
|
|
|
Item 1. |
3 |
|
|
|
|
Item 2. |
Management's Discussion and Analysis of Financial Condition and Results of Operations |
17 |
|
|
|
Item 3. |
26 |
|
|
|
|
Item 4. |
27 |
|
|
|
|
Part II. |
|
|
|
|
|
Item 1A. |
28 |
|
|
|
|
Item 6. |
29 |
|
|
|
|
30 |
||
|
|
|
2
GRAHAM CORPORATION AND SUBSIDIARIES
FORM 10-Q
SEPTEMBER 30, 2023
PART I – FINANCIAL INFORMATION
Item 1. Unaudited Condensed Consolidated Financial Statements
GRAHAM CORPORATION AND SUBSIDIARIES
CONDENSED CONSOLIDATED STATEMENTS OF OPERATIONS
(Dollar amounts in thousands, except per share data)
(Unaudited)
|
|
Three Months Ended |
|
|
Six Months Ended |
|
||||||||||
|
|
September 30, |
|
|
September 30, |
|
||||||||||
|
|
2023 |
|
|
2022 |
|
|
2023 |
|
|
2022 |
|
||||
Net sales |
|
$ |
|
|
$ |
|
|
$ |
|
|
$ |
|
||||
Cost of products sold |
|
|
|
|
|
|
|
|
|
|
|
|
||||
Gross profit |
|
|
|
|
|
|
|
|
|
|
|
|
||||
Other expenses and income: |
|
|
|
|
|
|
|
|
|
|
|
|
||||
Selling, general and administrative |
|
|
|
|
|
|
|
|
|
|
|
|
||||
Selling, general and administrative – amortization |
|
|
|
|
|
|
|
|
|
|
|
|
||||
Operating income (loss) |
|
|
|
|
|
( |
) |
|
|
|
|
|
|
|||
Other expense (income), net |
|
|
|
|
|
( |
) |
|
|
|
|
|
( |
) |
||
Interest expense, net |
|
|
|
|
|
|
|
|
|
|
|
|
||||
Income (loss) before provision (benefit) for income taxes |
|
|
|
|
|
( |
) |
|
|
|
|
|
|
|||
Provision (benefit) for income taxes |
|
|
|
|
|
( |
) |
|
|
|
|
|
|
|||
Net income (loss) |
|
$ |
|
|
$ |
( |
) |
|
$ |
|
|
$ |
|
|||
Per share data |
|
|
|
|
|
|
|
|
|
|
|
|
||||
Basic: |
|
|
|
|
|
|
|
|
|
|
|
|
||||
Net income (loss) |
|
$ |
|
|
$ |
( |
) |
|
$ |
|
|
$ |
|
|||
Diluted: |
|
|
|
|
|
|
|
|
|
|
|
|
||||
Net income (loss) |
|
$ |
|
|
$ |
( |
) |
|
$ |
|
|
$ |
|
|||
Weighted average common shares |
|
|
|
|
|
|
|
|
|
|
|
|
||||
Basic |
|
|
|
|
|
|
|
|
|
|
|
|
||||
Diluted |
|
|
|
|
|
|
|
|
|
|
|
|
||||
See Notes to Condensed Consolidated Financial Statements.
3
GRAHAM CORPORATION AND SUBSIDIARIES
CONDENSED CONSOLIDATED STATEMENTS OF COMPREHENSIVE INCOME (LOSS)
(Dollar amounts in thousands)
(Unaudited)
|
|
Three Months Ended |
|
|
Six Months Ended |
|
||||||||||
|
|
September 30, |
|
|
September 30, |
|
||||||||||
|
|
2023 |
|
|
2022 |
|
|
2023 |
|
|
2022 |
|
||||
Net income (loss) |
|
$ |
|
|
$ |
( |
) |
|
$ |
|
|
$ |
|
|||
Other comprehensive income (loss): |
|
|
|
|
|
|
|
|
|
|
|
|
||||
Foreign currency translation adjustment |
|
|
( |
) |
|
|
( |
) |
|
|
( |
) |
|
|
( |
) |
Defined benefit pension and other postretirement plans net |
|
|
|
|
|
|
|
|
|
|
|
|
||||
Total other comprehensive income (loss) |
|
|
|
|
|
( |
) |
|
|
|
|
|
( |
) |
||
Total comprehensive income (loss) |
|
$ |
|
|
$ |
( |
) |
|
$ |
|
|
$ |
|
|||
See Notes to Condensed Consolidated Financial Statements.
4
GRAHAM CORPORATION AND SUBSIDIARIES
CONDENSED CONSOLIDATED BALANCE SHEETS
(Dollar amounts in thousands, except per share data)
(Unaudited)
|
|
September 30, 2023 |
|
|
March 31, 2023 |
|
||
Assets |
|
|
|
|
|
|
||
Current assets: |
|
|
|
|
|
|
||
Cash and cash equivalents |
|
$ |
|
|
$ |
|
||
Trade accounts receivable, net of allowances ($ |
|
|
|
|
|
|
||
Unbilled revenue |
|
|
|
|
|
|
||
Inventories |
|
|
|
|
|
|
||
Prepaid expenses and other current assets |
|
|
|
|
|
|
||
Income taxes receivable |
|
|
|
|
|
|
||
Total current assets |
|
|
|
|
|
|
||
Property, plant and equipment, net |
|
|
|
|
|
|
||
Prepaid pension asset |
|
|
|
|
|
|
||
Operating lease assets |
|
|
|
|
|
|
||
Goodwill |
|
|
|
|
|
|
||
Customer relationships, net |
|
|
|
|
|
|
||
Technology and technical know-how, net |
|
|
|
|
|
|
||
Other intangible assets, net |
|
|
|
|
|
|
||
Deferred income tax asset |
|
|
|
|
|
|
||
Other assets |
|
|
|
|
|
|
||
Total assets |
|
$ |
|
|
$ |
|
||
Liabilities and stockholders’ equity |
|
|
|
|
|
|
||
Current liabilities: |
|
|
|
|
|
|
||
Current portion of long-term debt |
|
$ |
|
|
$ |
|
||
Current portion of finance lease obligations |
|
|
|
|
|
|
||
Accounts payable |
|
|
|
|
|
|
||
Accrued compensation |
|
|
|
|
|
|
||
Accrued expenses and other current liabilities |
|
|
|
|
|
|
||
Customer deposits |
|
|
|
|
|
|
||
Operating lease liabilities |
|
|
|
|
|
|
||
Income taxes payable |
|
|
|
|
|
|
||
Total current liabilities |
|
|
|
|
|
|
||
Long-term debt |
|
|
|
|
|
|
||
Finance lease obligations |
|
|
|
|
|
|
||
Operating lease liabilities |
|
|
|
|
|
|
||
Deferred income tax liability |
|
|
|
|
|
|
||
Accrued pension and postretirement benefit liabilities |
|
|
|
|
|
|
||
Other long-term liabilities |
|
|
|
|
|
|
||
Total liabilities |
|
|
|
|
|
|
||
|
|
|
|
|
|
|||
Stockholders’ equity: |
|
|
|
|
|
|
||
Preferred stock, $ |
|
|
|
|
|
|
||
Common stock, $ |
|
|
|
|
|
|
||
Capital in excess of par value |
|
|
|
|
|
|
||
Retained earnings |
|
|
|
|
|
|
||
Accumulated other comprehensive loss |
|
|
( |
) |
|
|
( |
) |
Treasury stock ( |
|
|
( |
) |
|
|
( |
) |
Total stockholders’ equity |
|
|
|
|
|
|
||
Total liabilities and stockholders’ equity |
|
$ |
|
|
$ |
|
||
See Notes to Condensed Consolidated Financial Statements.
5
GRAHAM CORPORATION AND SUBSIDIARIES
CONDENSED CONSOLIDATED STATEMENTS OF CASH FLOWS
(Dollar amounts in thousands)
(Unaudited)
|
|
Six Months Ended |
|
|||||
|
|
September 30, |
|
|||||
|
|
2023 |
|
|
2022 |
|
||
Operating activities: |
|
|
|
|||||
Net income |
|
$ |
|
|
$ |
|
||
Adjustments to reconcile net income to net cash provided (used) by operating |
|
|
|
|
|
|
||
Depreciation |
|
|
|
|
|
|
||
Amortization of intangible assets |
|
|
|
|
|
|
||
Amortization of actuarial losses |
|
|
|
|
|
|
||
Amortization of debt issuance costs |
|
|
|
|
|
|
||
Equity-based compensation expense |
|
|
|
|
|
|
||
Deferred income taxes |
|
|
|
|
|
|
||
(Increase) decrease in operating assets: |
|
|
|
|
|
|
||
Accounts receivable |
|
|
( |
) |
|
|
|
|
Unbilled revenue |
|
|
|
|
|
( |
) |
|
Inventories |
|
|
( |
) |
|
|
( |
) |
Prepaid expenses and other current and non-current assets |
|
|
( |
) |
|
|
( |
) |
Income taxes receivable |
|
|
( |
) |
|
|
( |
) |
Operating lease assets |
|
|
|
|
|
|
||
Prepaid pension asset |
|
|
( |
) |
|
|
( |
) |
Increase (decrease) in operating liabilities: |
|
|
|
|
|
|
||
Accounts payable |
|
|
( |
) |
|
|
|
|
Accrued compensation, accrued expenses and other current and non-current |
|
|
|
|
|
|
||
Customer deposits |
|
|
|
|
|
|
||
Operating lease liabilities |
|
|
( |
) |
|
|
( |
) |
Long-term portion of accrued compensation, accrued pension and |
|
|
|
|
|
( |
) |
|
Net cash provided (used) by operating activities |
|
|
|
|
|
( |
) |
|
Investing activities: |
|
|
|
|
|
|
||
Purchase of property, plant and equipment |
|
|
( |
) |
|
|
( |
) |
Proceeds from disposal of property, plant and equipment |
|
|
|
|
|
|
||
Net cash used by investing activities |
|
|
( |
) |
|
|
( |
) |
Financing activities: |
|
|
|
|
|
|
||
Principal repayments on debt |
|
|
( |
) |
|
|
( |
) |
Proceeds from the issuance of debt |
|
|
|
|
|
|
||
Repayments on financing lease obligations |
|
|
( |
) |
|
|
( |
) |
Payment of debt issuance costs |
|
|
|
|
|
( |
) |
|
Issuance of common stock |
|
|
|
|
|
|
||
Purchase of treasury stock |
|
|
( |
) |
|
|
( |
) |
Net cash (used) provided by financing activities |
|
|
( |
) |
|
|
|
|
Effect of exchange rate changes on cash |
|
|
( |
) |
|
|
( |
) |
Net increase (decrease) in cash and cash equivalents |
|
|
|
|
|
( |
) |
|
Cash and cash equivalents at beginning of period |
|
|
|
|
|
|
||
Cash and cash equivalents at end of period |
|
$ |
|
|
$ |
|
||
See Notes to Condensed Consolidated Financial Statements.
6
GRAHAM CORPORATION AND SUBSIDIARIES
CONDENSED CONSOLIDATED STATEMENTS OF CHANGES IN STOCKHOLDERS’ EQUITY
(Dollar amounts in thousands)
(Unaudited)
|
|
Common Stock |
|
|
Capital in |
|
|
|
|
|
Accumulated |
|
|
|
|
|
Total |
|
||||||||||
|
|
|
|
|
Par |
|
|
Excess of |
|
|
Retained |
|
|
Comprehensive |
|
|
Treasury |
|
|
Stockholders' |
|
|||||||
|
|
Shares |
|
|
Value |
|
|
Par Value |
|
|
Earnings |
|
|
Loss |
|
|
Stock |
|
|
Equity |
|
|||||||
Balance at April 1, 2023 |
|
|
|
|
$ |
|
|
$ |
|
|
$ |
|
|
$ |
( |
) |
|
$ |
( |
) |
|
$ |
|
|||||
Comprehensive income (loss) |
|
|
|
|
|
|
|
|
|
|
|
|
|
|
( |
) |
|
|
|
|
|
|
||||||
Issuance of shares |
|
|
|
|
|
|
|
|
( |
) |
|
|
|
|
|
|
|
|
|
|
|
— |
|
|||||
Forfeiture of shares |
|
|
( |
) |
|
|
( |
) |
|
|
|
|
|
|
|
|
|
|
|
|
|
|
— |
|
||||
Recognition of equity-based |
|
|
|
|
|
|
|
|
|
|
|
|
|
|
|
|
|
|
|
|
|
|||||||
Issuance of treasury stock |
|
|
|
|
|
|
|
|
|
|
|
|
|
|
|
|
|
( |
) |
|
|
— |
|
|||||
Purchase of treasury stock |
|
|
|
|
|
|
|
|
|
|
|
|
|
|
|
|
|
( |
) |
|
|
( |
) |
|||||
Balance at June 30, 2023 |
|
|
|
|
|
|
|
|
|
|
|
|
|
|
( |
) |
|
|
( |
) |
|
|
|
|||||
Comprehensive income |
|
|
|
|
|
|
|
|
|
|
|
|
|
|
|
|
|
|
|
|
|
|||||||
Issuance of shares |
|
|
|
|
|
|
|
|
|
|
|
|
|
|
|
|
|
|
|
|
|
|||||||
Recognition of equity-based |
|
|
|
|
|
|
|
|
|
|
|
|
|
|
|
|
|
|
|
|
|
|||||||
Balance at September 30, 2023 |
|
|
|
|
$ |
|
|
$ |
|
|
$ |
|
|
$ |
( |
) |
|
$ |
( |
) |
|
$ |
|
|||||
|
|
|
|
|
|
|
|
|
|
|
|
|
|
|
|
|
|
|
|
|
|
|||||||
|
|
Common Stock |
|
|
Capital in |
|
|
|
|
|
Accumulated |
|
|
|
|
|
Total |
|
||||||||||
|
|
|
|
|
Par |
|
|
Excess of |
|
|
Retained |
|
|
Comprehensive |
|
|
Treasury |
|
|
Stockholders' |
|
|||||||
|
|
Shares |
|
|
Value |
|
|
Par Value |
|
|
Earnings |
|
|
Loss |
|
|
Stock |
|
|
Equity |
|
|||||||
Balance at April 1, 2022 |
|
|
|
|
$ |
|
|
$ |
|
|
$ |
|
|
$ |
( |
) |
|
$ |
( |
) |
|
$ |
|
|||||
Comprehensive income (loss) |
|
|
|
|
|
|
|
|
|
|
|
|
|
|
( |
) |
|
|
|
|
|
|
||||||
Forfeiture of shares |
|
|
( |
) |
|
|
( |
) |
|
|
|
|
|
|
|
|
|
|
|
|
|
|
— |
|
||||
Recognition of equity-based |
|
|
|
|
|
|
|
|
|
|
|
|
|
|
|
|
|
|
|
|
|
|||||||
Purchase of treasury stock |
|
|
|
|
|
|
|
|
|
|
|
|
|
|
|
|
|
( |
) |
|
|
( |
) |
|||||
Balance at June 30, 2022 |
|
|
|
|
|
|
|
|
|
|
|
|
|
|
( |
) |
|
|
( |
) |
|
|
|
|||||
Comprehensive loss |
|
|
|
|
|
|
|
|
|
|
|
( |
) |
|
|
( |
) |
|
|
|
|
|
( |
) |
||||
Forfeiture of shares |
|
|
( |
) |
|
|
( |
) |
|
|
|
|
|
|
|
|
|
|
|
|
|
|
— |
|
||||
Recognition of equity-based |
|
|
|
|
|
|
|
|
|
|
|
|
|
|
|
|
|
|
|
|
|
|||||||
Issuance of treasury stock |
|
|
|
|
|
|
|
|
( |
) |
|
|
|
|
|
|
|
|
|
|
|
|
||||||
Balance at September 30, 2022 |
|
|
|
|
$ |
|
|
$ |
|
|
$ |
|
|
$ |
( |
) |
|
$ |
( |
) |
|
$ |
|
|||||
See Notes to Condensed Consolidated Financial Statements.
7
GRAHAM CORPORATION AND SUBSIDIARIES
NOTES TO CONDENSED CONSOLIDATED FINANCIAL STATEMENTS
(Amounts in thousands, except per share data)
(Unaudited)
NOTE 1 – BASIS OF PRESENTATION:
Graham Corporation's (the "Company's") Condensed Consolidated Financial Statements include its wholly-owned subsidiaries located in Arvada, Colorado, Suzhou, China and Ahmedabad, India at September 30 and March 31, 2023. The Condensed Consolidated Financial Statements have been prepared in accordance with accounting principles generally accepted in the U.S. ("GAAP") for interim financial information and the instructions to Form 10-Q and Rule 8-03 of Regulation S-X, each as promulgated by the U.S. Securities and Exchange Commission. The Company's Condensed Consolidated Financial Statements do not include all information and notes required by GAAP for complete financial statements. The unaudited Condensed Consolidated Balance Sheet as of March 31, 2023 presented herein was derived from the Company’s audited Consolidated Balance Sheet as of March 31, 2023. For additional information, please refer to the consolidated financial statements and notes included in the Company's Annual Report on Form 10-K for the fiscal year ended March 31, 2023 ("fiscal 2023"). In the opinion of management, all adjustments, including normal recurring accruals considered necessary for a fair presentation, have been included in the Company's Condensed Consolidated Financial Statements.
The Company's results of operations and cash flows for the three and six months ended September 30, 2023 are not necessarily indicative of the results that may be expected for the current fiscal year, which ends March 31, 2024 ("fiscal 2024").
NOTE 2 – REVENUE RECOGNITION:
The Company recognizes revenue on contracts when or as it satisfies a performance obligation by transferring control of the product to the customer. For contracts in which revenue is recognized upon shipment, control is generally transferred when products are shipped, title is transferred, significant risks of ownership have transferred, the Company has rights to payment, and rewards of ownership pass to the customer. For contracts in which revenue is recognized over time, control is generally transferred as the Company creates an asset that does not have an alternative use to the Company and the Company has an enforceable right to payment for the performance completed to date.
The following table presents the Company’s revenue disaggregated by product line and geographic area:
|
|
Three Months Ended |
|
|
Six Months Ended |
|
||||||||||
|
|
September 30, |
|
|
September 30, |
|
||||||||||
Market |
|
2023 |
|
|
2022 |
|
|
2023 |
|
|
2022 |
|
||||
Refining |
|
$ |
|
|
$ |
|
|
$ |
|
|
$ |
|
||||
Chemical/Petrochemical |
|
|
|
|
|
|
|
|
|
|
|
|
||||
Defense |
|
|
|
|
|
|
|
|
|
|
|
|
||||
Space |
|
|
|
|
|
|
|
|
|
|
|
|
||||
Other Commercial |
|
|
|
|
|
|
|
|
|
|
|
|
||||
Net sales |
|
$ |
|
|
$ |
|
|
$ |
|
|
$ |
|
||||
|
|
|
|
|
|
|
|
|
|
|
|
|
||||
|
|
|
|
|
|
|
|
|
|
|
|
|
||||
Geographic Area |
|
|
|
|
|
|
|
|
|
|
|
|
||||
Asia |
|
$ |
|
|
$ |
|
|
$ |
|
|
$ |
|
||||
Canada |
|
|
|
|
|
|
|
|
|
|
|
|
||||
Middle East |
|
|
|
|
|
|
|
|
|
|
|
|
||||
South America |
|
|
|
|
|
|
|
|
|
|
|
|
||||
U.S. |
|
|
|
|
|
|
|
|
|
|
|
|
||||
All other |
|
|
|
|
|
|
|
|
|
|
|
|
||||
Net sales |
|
$ |
|
|
$ |
|
|
$ |
|
|
$ |
|
||||
A performance obligation represents a promise in a contract to provide a distinct good or service to a customer. The Company accounts for a contract when it has approval and commitment from both parties, the rights of the parties are identified, payment terms
8
are identified, the contract has commercial substance and collectability of consideration is probable. Transaction price reflects the amount of consideration to which the Company expects to be entitled in exchange for transferred products. A contract’s transaction price is allocated to each distinct performance obligation and revenue is recognized as the performance obligation is satisfied. In certain cases, the Company may separate a contract into more than one performance obligation, while in other cases, several products may be part of a fully integrated solution and are bundled into a single performance obligation. If a contract is separated into more than one performance obligation, the Company allocates the total transaction price to each performance obligation in an amount based on the estimated relative standalone selling prices of the promised goods underlying each performance obligation. The Company has made an accounting policy election to exclude from the measurement of the contract price all taxes assessed by government authorities that are collected by the Company from its customers. The Company does not adjust the contract price for the effects of a financing component if the Company expects, at contract inception, that the period between when a product is transferred to a customer and when the customer pays for the product will be one year or less. Shipping and handling fees billed to the customer are recorded in revenue and the related costs incurred for shipping and handling are included in Cost of products sold.
The Company recognizes revenue over time when contract performance results in the creation of a product for which the Company does not have an alternative use and the contract includes an enforceable right to payment in an amount that corresponds directly with the value of the performance completed. To measure progress towards completion on performance obligations for which revenue is recognized over time the Company utilizes an input method based upon a ratio of direct labor hours incurred to date to management’s estimate of the total labor hours to be incurred on each contract, an input method based upon a ratio of total contract costs incurred to date to management’s estimate of the total contract costs to be incurred or an output method based upon completion of operational milestones, depending upon the nature of the contract. The Company has established the systems and procedures essential to developing the estimates required to account for performance obligations over time. These procedures include monthly review by management of costs incurred, progress towards completion, identified risks and opportunities, sourcing determinations, changes in estimates of costs yet to be incurred, availability of materials, and execution by subcontractors. Sales and earnings are adjusted in current accounting periods based on revisions in the contract value due to pricing changes and estimated costs at completion. Losses on contracts are recognized immediately when evident to management. Revenue on the majority of the Company's contracts, as measured by number of contracts, is recognized upon shipment to the customer. Revenue on larger contracts, which are fewer in number but represent the majority of revenue, is recognized over time.
|
|
Three Months Ended |
|
|
Six Months Ended |
|
||||||||||
|
|
September 30, |
|
|
September 30, |
|
||||||||||
|
|
2023 |
|
|
2022 |
|
|
2023 |
|
|
2022 |
|
||||
|
|
|
|
|
|
|
|
|
|
|
|
|
||||
Revenue recognized over time |
|
|
% |
|
|
% |
|
|
% |
|
|
% |
||||
Revenue recognized at shipment |
|
|
% |
|
|
% |
|
|
% |
|
|
% |
||||
The timing of revenue recognition, invoicing and cash collections affect trade accounts receivable, unbilled revenue (contract assets) and customer deposits (contract liabilities) on the Condensed Consolidated Balance Sheets. Unbilled revenue represents revenue on contracts that is recognized over time and exceeds the amount that has been billed to the customer. Unbilled revenue is separately presented in the Condensed Consolidated Balance Sheets. The Company may have an unconditional right to payment upon billing and prior to satisfying the performance obligations. The Company will then record a contract liability and an offsetting asset of equal amount until the deposit is collected and the performance obligations are satisfied. Customer deposits are separately presented in the Condensed Consolidated Balance Sheets. Customer deposits are not considered a significant financing component as they are generally received less than one year before the product is completed or used to procure specific material on a contract, as well as related overhead costs incurred during design and construction.
Net contract assets (liabilities) consisted of the following:
|
|
September 30, 2023 |
|
|
March 31, 2023 |
|
|
Change |
|
|
Change due to revenue recognized |
|
|
Change due to invoicing customers/ |
|
|||||
|
|
|
|
|
|
|
|
|
|
|
|
|
|
|
|
|||||
Unbilled revenue (contract assets) |
|
$ |
|
|
$ |
|
|
$ |
( |
) |
|
$ |
|
|
$ |
( |
) |
|||
Customer deposits (contract liabilities) |
|
|
( |
) |
|
|
( |
) |
|
|
( |
) |
|
|
|
|
|
( |
) |
|
Net contract (liabilities) assets |
|
$ |
( |
) |
|
$ |
( |
) |
|
$ |
( |
) |
|
|
|
|
|
|
||
9
Contract liabilities at September 30 and March 31, 2023 include $
Receivables billed but not paid under retainage provisions in the Company’s customer contracts were $
The Company’s remaining unsatisfied performance obligations represent a measure of the total dollar value of work to be performed on contracts awarded and in progress. The Company also refers to this measure as backlog. As of September 30, 2023, the Company had remaining unsatisfied performance obligations of $
NOTE 3 – INVENTORIES:
Inventories are stated at the lower of cost or net realizable value, using the average cost method.
Major classifications of inventories are as follows:
|
|
September 30, |
|
|
March 31, |
|
||
|
|
2023 |
|
|
2023 |
|
||
Raw materials and supplies |
|
$ |
|
|
$ |
|
||
Work in process |
|
|
|
|
|
|
||
Finished products |
|
|
|
|
|
|
||
Total |
|
$ |
|
|
$ |
|
||
NOTE 4 – INTANGIBLE ASSETS:
Intangible assets are comprised of the following:
|
Weighted Average Amortization Period |
|
Gross Carrying Amount |
|
|
Accumulated Amortization |
|
|
Net Carrying Amount |
|
|||
At September 30, 2023 |
|
|
|
|
|
|
|
|
|
|
|||
Intangibles subject to amortization: |
|
|
|
|
|
|
|
|
|
|
|||
Customer relationships |
|
$ |
|
|
$ |
|
|
$ |
|
||||
Technology and technical know-how |
|
|
|
|
|
|
|
|
|
||||
Backlog |
|
|
|
|
|
|
|
|
|
||||
|
|
|
$ |
|
|
$ |
|
|
$ |
|
|||
|
|
|
|
|
|
|
|
|
|
|
|||
Intangibles not subject to amortization: |
|
|
|
|
|
|
|
|
|
|
|||
Tradename |
|
$ |
|
|
$ |
— |
|
|
$ |
|
|||
|
|
|
$ |
|
|
$ |
— |
|
|
$ |
|
||
Technology and technical know-how and Customer relationships are amortized in Selling, general and administrative expense on a straight line basis over their estimated useful lives. Backlog is amortized in Cost of products sold over the projected conversion period based on management estimates at time of purchase. Intangible amortization was $
10
|
|
Annual Amortization |
|
|
Remainder of 2024 |
|
$ |
|
|
2025 |
|
|
|
|
2026 |
|
|
|
|
2027 |
|
|
|
|
2028 |
|
|
|
|
2029 and thereafter |
|
|
|
|
Total intangible amortization |
|
$ |
|
|
|
|
|
|
|
NOTE 5 – EQUITY-BASED COMPENSATION:
The 2020 Graham Corporation Equity Incentive Plan, as amended (the "2020 Plan"), provides for the issuance of
|
|
Vest |
|
|
Vest Per Year |
|
|
Vest |
|
|
|
|||
|
|
Anniversary (1) |
|
|
Over Term (1) |
|
|
Anniversary (1) |
|
|
|
|||
|
|
|
|
|
Officers and |
|
|
Officers and |
|
|
Total Shares |
|||
Six months ended September 30, |
|
Directors |
|
|
Key Employees |
|
|
Key Employees |
|
|
Awarded |
|||
2023 |
|
|
|
|
|
|
|
|
|
|
|
|||
Time Vesting RSUs |
|
|
|
|
|
|
|
|
||||||
Performance Vesting PSUs |
|
|
|
|
|
|
|
|
|
|||||
2022 |
|
|
|
|
|
|
|
|
|
|
|
|||
Time Vesting RSUs |
|
|
|
|
|
|
|
|||||||
Performance Vesting PSUs |
|
|
|
|
|
|
|
|
|
|||||
The Company has an Employee Stock Purchase Plan, as amended (the "ESPP"), which allows eligible employees to purchase shares of the Company's common stock at a discount of up to
The Company has recognized equity-based compensation costs as follows:
|
|
Three Months Ended |
|
|
Six Months Ended |
|
||||||||||
|
|
September 30, |
|
|
September 30, |
|
||||||||||
|
|
2023 |
|
|
2022 |
|
|
2023 |
|
|
2022 |
|
||||
Restricted stock awards |
|
$ |
|
|
$ |
|
|
$ |
|
|
$ |
|
||||
Restricted stock units |
|
|
|
|
|
|
|
|
|
|
|
|
||||
Employee stock purchase plan |
|
|
|
|
|
( |
) |
|
|
|
|
|
|
|||
|
|
$ |
|
|
$ |
|
|
$ |
|
|
$ |
|
||||
|
|
|
|
|
|
|
|
|
|
|
|
|
||||
Income tax benefit recognized |
|
$ |
|
|
$ |
|
|
$ |
|
|
$ |
|
||||
NOTE 6 – INCOME (LOSS) PER SHARE:
Basic income (loss) per share is computed by dividing net income (loss) by the weighted average number of common shares outstanding for the period. Diluted income (loss) per share is calculated by dividing net income (loss) by the weighted average number
11
of common shares outstanding and, when applicable, potential common shares outstanding during the period.
|
|
Three Months Ended |
|
|
Six Months Ended |
|
||||||||||
|
|
September 30, |
|
|
September 30, |
|
||||||||||
|
|
2023 |
|
|
2022 |
|
|
2023 |
|
|
2022 |
|
||||
Basic income (loss) per share |
|
|
|
|
|
|
|
|
|
|
|
|
||||
Numerator: |
|
|
|
|
|
|
|
|
|
|
|
|
||||
Net income (loss) |
|
$ |
|
|
$ |
( |
) |
|
$ |
|
|
$ |
|
|||
Denominator: |
|
|
|
|
|
|
|
|
|
|
|
|
||||
Weighted average common shares |
|
|
|
|
|
|
|
|
|
|
|
|
||||
Basic income (loss) per share |
|
$ |
|
|
$ |
( |
) |
|
$ |
|
|
$ |
|
|||
|
|
|
|
|
|
|
|
|
|
|
|
|
||||
Diluted income (loss) per share |
|
|
|
|
|
|
|
|
|
|
|
|
||||
Numerator: |
|
|
|
|
|
|
|
|
|
|
|
|
||||
Net income (loss) |
|
$ |
|
|
$ |
( |
) |
|
$ |
|
|
$ |
|
|||
Denominator: |
|
|
|
|
|
|
|
|
|
|
|
|
||||
Weighted average common shares |
|
|
|
|
|
|
|
|
|
|
|
|
||||
Restricted stock units outstanding |
|
|
|
|
|
|
|
|
|
|
|
|
||||
Weighted average common and |
|
|
|
|
|
|
|
|
|
|
|
|
||||
Diluted income (loss) per share |
|
$ |
|
|
$ |
( |
) |
|
$ |
|
|
$ |
|
|||
NOTE 7 – PRODUCT WARRANTY LIABILITY:
The reconciliation of the changes in the product warranty liability is as follows:
|
|
Three Months Ended |
|
|
Six Months Ended |
|
||||||||||
|
|
September 30, |
|
|
September 30, |
|
||||||||||
|
|
2023 |
|
|
2022 |
|
|
2023 |
|
|
2022 |
|
||||
Balance at beginning of period |
|
$ |
|
|
$ |
|
|
$ |
|
|
$ |
|
||||
Expense for product warranties |
|
|
|
|
|
|
|
|
|
|
|
|
||||
Product warranty claims paid |
|
|
( |
) |
|
|
( |
) |
|
|
( |
) |
|
|
( |
) |
Balance at end of period |
|
$ |
|
|
$ |
|
|
$ |
|
|
$ |
|
||||
The product warranty liability is included in the line item Accrued expenses and other current liabilities in the Condensed Consolidated Balance Sheets.
NOTE 8 – CASH FLOW STATEMENT:
Interest and income taxes paid as well as non-cash investing and financing activities are as follows:
|
|
For the Six Months Ended September 30, |
|
|||||
|
|
2023 |
|
|
2022 |
|
||
Interest paid |
|
$ |
|
|
$ |
|
||
Income taxes paid |
|
|
|
|
|
|
||
Capital purchases recorded in accounts payable |
|
|
|
|
|
|
||
NOTE 9 – COMMITMENTS AND CONTINGENCIES:
The Company has been named as a defendant in lawsuits alleging personal injury from exposure to asbestos allegedly contained in, or accompanying, products made by the Company. The Company is a co-defendant with numerous other defendants in these lawsuits and intends to vigorously defend itself against these claims. The claims in the Company’s current lawsuits are similar to those made in previous asbestos-related suits that named the Company as a defendant, which either were dismissed when it was shown that the
12
Company had not supplied products to the plaintiffs’ places of work or were settled for immaterial amounts. The Company cannot provide any assurances that any pending or future matters will be resolved in the same manner as previous lawsuits.
As of September 30, 2023, the Company was subject to the claims noted above, as well as other potential claims that have arisen in the ordinary course of business.
Although the outcome of the lawsuits, legal proceedings or potential claims to which the Company is, or may become, a party to cannot be determined and an estimate of the reasonably possible loss or range of loss cannot be made for the majority of the claims, management does not believe that the outcomes, either individually or in the aggregate, will have a material adverse effect on the Company’s results of operations, financial position or cash flows.
The Company previously entered into related party operating leases with Ascent Properties Group, LLC ("Ascent"), for two building lease agreements and two equipment lease agreements in Arvada, Colorado. In connection with such leases, the Company made fixed minimum lease payments to the lessor of $
NOTE 10 – INCOME TAXES:
The Company files federal and state income tax returns in several domestic and international jurisdictions. In most tax jurisdictions, returns are subject to examination by the relevant tax authorities for a number of years after the returns have been filed. The Company is subject to U.S. federal examination for the tax years
There was
NOTE 11 – CHANGES IN ACCUMULATED OTHER COMPREHENSIVE LOSS:
The changes in accumulated other comprehensive loss by component for the six months ended September 30, 2023 and 2022 are as follows:
|
|
Pension and |
|
|
Foreign |
|
|
Total |
|
|||
Balance at April 1, 2023 |
|
$ |
( |
) |
|
$ |
|
|
$ |
( |
) |
|
Other comprehensive income before reclassifications |
|
|
|
|
|
( |
) |
|
|
( |
) |
|
Amounts reclassified from accumulated other comprehensive |
|
|
|
|
|
|
|
|
|
|||
Net current-period other comprehensive income (loss) |
|
|
|
|
|
( |
) |
|
|
|
||
Balance at September 30, 2023 |
|
$ |
( |
) |
|
$ |
( |
) |
|
$ |
( |
) |
|
|
Pension and |
|
|
Foreign |
|
|
Total |
|
|||
Balance at April 1, 2022 |
|
$ |
( |
) |
|
$ |
|
|
$ |
( |
) |
|
Other comprehensive income before reclassifications |
|
|
|
|
|
( |
) |
|
|
( |
) |
|
Amounts reclassified from accumulated other comprehensive |
|
|
|
|
|
|
|
|
|
|||
Net current-period other comprehensive income (loss) |
|
|
|
|
|
( |
) |
|
$ |
( |
) |
|
Balance at September 30, 2022 |
|
$ |
( |
) |
|
$ |
( |
) |
|
$ |
( |
) |
13
The reclassifications out of accumulated other comprehensive loss by component for the three and six months ended September 30, 2023 and 2022 are as follows:
Details about Accumulated Other |
|
Amount Reclassified from |
|
|
|
Affected Line Item in the Condensed |
||||||
|
|
Three Months Ended |
|
|
|
|
||||||
|
|
September 30, |
|
|
|
|
||||||
|
|
2023 |
|
|
|
2022 |
|
|
|
|
||
Pension and other postretirement benefit items: |
|
|
|
|
|
|
|
|
|
|
||
Amortization of actuarial loss |
|
$ |
|
(1) |
|
$ |
|
(1) |
|
Income before benefit for income taxes |
||
Tax effect |
|
|
|
|
|
|
|
|
|
Provision for income taxes |
||
|
|
$ |
|
|
|
$ |
|
|
|
Net income |
||
Details about Accumulated Other |
|
Amount Reclassified from |
|
|
|
Affected Line Item in the Condensed |
||||||
|
|
Six Months Ended |
|
|
|
|
||||||
|
|
September 30, |
|
|
|
|
||||||
|
|
2023 |
|
|
|
2022 |
|
|
|
|
||
Pension and other postretirement benefit items: |
|
|
|
|
|
|
|
|
|
|
||
Amortization of actuarial loss |
|
$ |
|
(1) |
|
$ |
|
(1) |
|
Income before benefit for income taxes |
||
Tax effect |
|
|
|
|
|
|
|
|
|
Provision for income taxes |
||
|
|
$ |
|
|
|
$ |
|
|
|
Net income |
||
NOTE 12 – DEBT:
On June 1, 2021, the Company entered into a $
As of March 31, 2023 and September 30, 2023, long term debt was comprised of the following:
|
|
September 30, |
|
|
March 31, |
|
||
|
|
2023 |
|
|
2023 |
|
||
Bank of America term loan |
|
$ |
|
|
$ |
|
||
Less: unamortized debt issuance costs |
|
|
( |
) |
|
|
( |
) |
|
|
|
|
|
|
|
||
Less: current portion |
|
|
|
|
|
|
||
Total |
|
$ |
|
|
$ |
|
||
As of September 30, 2023, future minimum payments required were as follows:
Remainder of 2024 |
|
$ |
|
|
2025 |
|
|
|
|
2026 |
|
|
|
|
2027 |
|
|
|
|
2028 and thereafter |
|
|
|
|
Total |
|
$ |
|
On June 1, 2021, the Company entered into a five-year revolving credit facility with Bank of America (the "Revolving Credit Facility") that provided a $
14
were subject to a fee of
Under the Term Loan and Revolving Credit Facility, as amended (the "Credit Facility"), the Company covenanted to maintain a maximum total leverage ratio, as defined in the Credit Facility, of
In connection with the amendments to the Credit Facility, the Company was charged a back-end fee of $
The Company has a letter of credit facility agreement with HSBC Bank USA, N.A. of $
Total letters of credit outstanding as of September 30, and March 31, 2023 were $
SUBSEQUENT EVENT
On October 13, 2023, the Company terminated the Revolving Credit Facility, repaid the Term Loan and entered into a new
The New Revolving Credit Facility contains customary terms and conditions, including representations and warranties and affirmative and negative covenants, as well as financial covenants for the benefit of Wells Fargo, which require the Company to maintain (i) a consolidated total leverage ratio not to exceed
Borrowings under the New Revolving Credit Facility bear interest at a rate equal to, at the Company’s
The Company will incur a quarterly commitment fee on the unused portion of the New Revolving Credit Facility during the applicable quarter at a per annum rate also determined by reference to the Company’s then-current consolidated total leverage ratio, which fee ranges between
15
of credit issued under the New Revolving Credit Facility will bear a fee equal to the daily amount drawn under such letters of credit multiplied by the applicable margin for term SOFR loans.
In connection with the termination of the Revolving Credit Facility, the Company repaid the $
16
Item 2. Management’s Discussion and Analysis of Financial Condition and Results of Operations
(Dollar and share amounts in thousands, except per share data)
Overview
We are a global leader in the design and manufacture of mission critical fluid, power, heat transfer and vacuum technologies for the defense, space, energy and process industries. We design and manufacture custom-engineered vacuum, heat transfer, pump and turbomachinery technologies. For the defense industry, our equipment is used in nuclear and non-nuclear propulsion, power, fluid transfer, and thermal management systems. For the space industry our equipment is used in propulsion, power and energy management systems and for life support systems. We supply equipment for vacuum, heat transfer and fluid transfer applications used in energy and new energy markets including oil refining, cogeneration, and multiple alternative and clean power applications including hydrogen. For the chemical and petrochemical industries, our heat transfer equipment is used in fertilizer, ethylene, methanol and downstream chemical facilities.
Our brands are built upon engineering expertise and close customer collaboration to design, develop, and produce mission critical equipment and systems that enable our customers to meet their economic and operational objectives. Continual improvement of our processes and systems to ensure qualified and compliant equipment are hallmarks of our brand. Our early engagement with customers and support until the end of service life are values upon which our brands are built.
Our corporate headquarters is located with our production facilities in Batavia, New York, where surface condensers and ejectors are designed, engineered, and manufactured. Our wholly-owned subsidiary, Barber-Nichols, LLC ("BN"), based in Arvada, Colorado, designs, develops, manufactures and sells specialty turbomachinery products for the space, aerospace, cryogenic, defense and energy markets. We also have wholly-owned foreign subsidiaries, Graham Vacuum and Heat Transfer Technology Co., Ltd. ("GVHTT"), located in Suzhou, China and Graham India Private Limited ("GIPL"), located in Ahmedabad, India. GVHTT provides sales and engineering support for us throughout Southeast Asia. GIPL serves as a sales and market development office focusing on the refining, petrochemical, edible oils, and fertilizer markets in India and the Middle East.
We refer to our fiscal year, which ends March 31, 2024, as fiscal 2024. Likewise, we refer to our fiscal year that ended March 31, 2023 and March 31, 2022 as fiscal 2023 and fiscal 2022, respectively.
Summary
Highlights for the three months ended September 30, 2023 include:
17
Cautionary Note Regarding Forward-Looking Statements
This report on Form 10-Q (the "Form 10-Q") and other documents we file with the Securities and Exchange Commission ("SEC") include forward-looking statements within the meaning of Section 27A of the Securities Act of 1933, as amended, and Section 21E of the Securities Exchange Act of 1934, as amended. All statements other than statements of historical fact are forward-looking statements for purposes of this Form 10-K. These statements involve known and unknown risks, uncertainties and other factors that may cause actual results to be materially different from any future results implied by the forward-looking statements. Forward-looking statements are indicated by words such as "anticipate," "believe," "continue," "could," "estimate," "can," "may," "intend," "expect," "plan," "goal," "predict," "project," "outlook," "potential," "should," "will," and similar words and expressions.
Forward-looking statements are not a guarantee of future performance and involve risks and uncertainties, and there are certain important factors that could cause our actual results to differ, possibly materially, from expectations or estimates reflected in such forward-looking statements including, but not limited to, those described in the "Risk Factors" section in Item 1A of our Annual Report on Form 10-K for fiscal 2023 and elsewhere in the reports we file with the SEC. Undue reliance should not be placed on our forward-looking statements. New risks and uncertainties arise from time to time and we cannot predict these events or how they may affect us and cause actual results to differ materially from those expressed or implied by our forward-looking statements. Therefore, you should not rely on our forward-looking statements as predictions of future events. When considering these risks, uncertainties and assumptions, you should keep in mind the cautionary statements contained in this report and any documents incorporated herein by reference. You should read this document and the documents that we reference in this Quarterly Report on Form 10-Q (the "Form 10-Q") completely and with the understanding that our actual future results may be materially different from what we expect. All forward-looking statements attributable to us are expressly qualified by these cautionary statements.
All forward-looking statements included in this Form 10-Q are made only as of the date indicated or as of the date of this Form 10-Q. Except as required by law, we undertake no obligation to update or announce any revisions to forward-looking statements contained in this report, whether as a result of new information, future events or otherwise.
Current Market Conditions
Demand for our equipment and systems for the defense industry is expected to remain strong and continue to expand, based on defense budget plans, accelerated ship build schedules due to geopolitical tensions, the projected build schedule of submarines, aircraft carriers and undersea propulsion and power systems and the solutions we provide. In addition to U.S. Navy applications, we also provide specialty pumps, turbines, compressors and controllers for various fluid and thermal management systems used in Department of Defense radar, laser, electronics and power systems. We have built a leading position, and in some instances, a sole source position, for certain systems and equipment for the defense industry.
Our traditional energy markets are undergoing significant transition. While we expect that fossil fuels will continue to be an important component in the global energy industry for many years to come, there are significant changes in the priorities for capital investments by our customers and the regions in which those investments are being made. We expect that the systemic changes in the energy markets, which are influenced by the increasing use by consumers of alternative fuels, will lead to demand growth for fossil-based fuels that is less than the global growth rate. The timing and catalyst for a recovery in this market remains uncertain. Accordingly,
18
we believe that in the near term the quantity of projects available for us to compete for will remain low and that new project pricing will remain challenging.
Of note, over the last few years we have experienced an increase in our energy and chemical aftermarket orders, primarily from the domestic market. Aftermarket orders have historically been a leading indicator of future capital investment by our customers in their facilities for upgrades and expansions. However, if a capital investment upturn were to occur, we do not expect the next cycle to be as robust as years past due to the factors discussed above.
The alternative and clean energy opportunities for our heat transfer, power production and fluid transfer systems are expected to continue to grow. We assist in designing, developing and producing equipment for hydrogen production, distribution and fueling systems, concentrated solar power and storage, small modular nuclear systems and geothermal power generation with lithium extraction. We are positioning the Company to be a more significant contributor as these markets continue to develop.
We believe that chemical and petrochemical capital investment will continue to decouple from energy investment. Over the long term, we expect that population growth, an expanding global middle class, and an increasing desire for improved quality of life and access to consumer products will drive increased demand for industrial goods within the plastics and resins value chain along with fertilizers and related products. As such, we expect investment in new global chemical and petrochemical capacity will improve and drive growth in demand for our products and services.
Our turbomachinery, pumps and cryogenic products and market access provide revenue and growth potential in the commercial space/aerospace markets. The commercial space market has grown and evolved rapidly, and we provide rocket engine turbo pump systems and components for many of the launch providers for satellites. We expect that in the long term extended space exploration will become more prevalent, and we anticipate that our thermal/fluid management and environmental control and life support system turbomachinery will play important roles. We are also participating in future aerospace power and propulsion system development through supply of fluid and thermal management systems components. Small power dense systems are imperative for these applications and we believe our technology and expertise will enable us to achieve sales growth in this market as well. Sales and orders to the space industry are variable in nature and many of our customers, who are key players in the industry, have yet to achieve profitability and may be unable to continue operations without additional funding, similar to what occurred to Virgin Orbit. Thus, future revenue and growth in this market can be uncertain and may negatively impact our business.
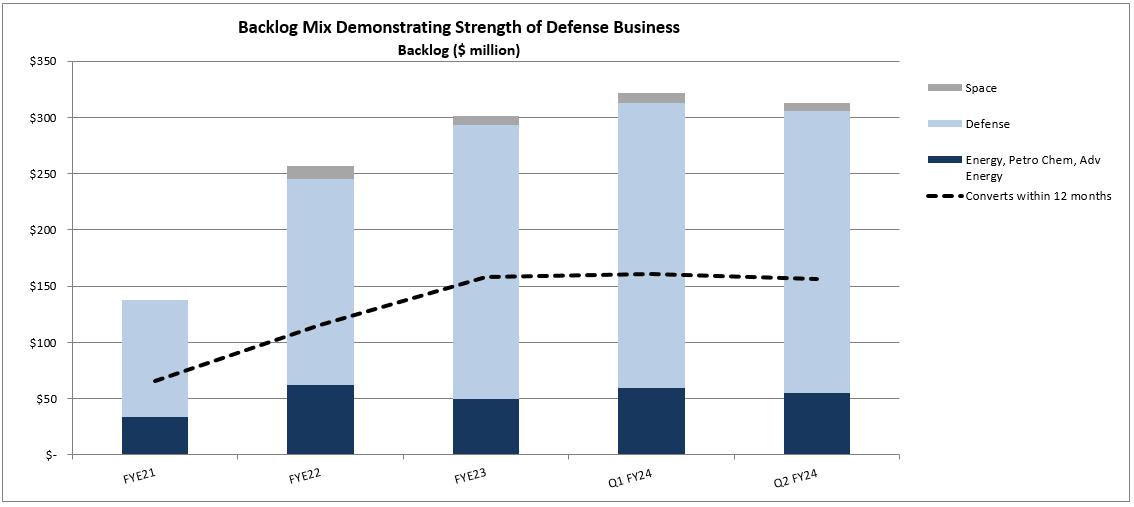
As illustrated below, we have succeeded over the last several years with our strategy to increase our participation in the defense market as opportunities in our legacy refining and petrochemical markets diminished. The defense market comprised 80% of our total backlog at September 30, 2023.
*Note: "FYE" refers to fiscal year ended March 31
19
Results of Operations
To better understand the significant factors that influenced our performance during the periods presented, the following discussion should be read in conjunction with our Condensed Consolidated Financial Statements and the notes to our Condensed Consolidated Financial Statements included in Part I, Item 1, of this Form 10-Q.
The following table summarizes our results of operations for the periods indicated:
|
|
Three Months Ended |
|
|
Six Months Ended |
|
||||||||||
|
|
September 30, |
|
|
September 30, |
|
||||||||||
|
|
2023 |
|
|
2022 |
|
|
2023 |
|
|
2022 |
|
||||
Net sales |
|
$ |
45,076 |
|
|
$ |
38,143 |
|
|
$ |
92,645 |
|
|
$ |
74,218 |
|
Gross profit |
|
$ |
7,191 |
|
|
$ |
5,280 |
|
|
$ |
18,168 |
|
|
$ |
12,024 |
|
Gross profit margin |
|
|
16 |
% |
|
|
14 |
% |
|
|
20 |
% |
|
|
16 |
% |
SG&A expenses (1) |
|
$ |
6,388 |
|
|
$ |
5,332 |
|
|
$ |
13,681 |
|
|
$ |
11,091 |
|
SG&A as a percent of sales |
|
|
14 |
% |
|
|
14 |
% |
|
|
15 |
% |
|
|
15 |
% |
Net income (loss) |
|
$ |
411 |
|
|
$ |
(196 |
) |
|
$ |
3,051 |
|
|
$ |
480 |
|
Income (loss) per diluted share |
|
$ |
0.04 |
|
|
$ |
(0.02 |
) |
|
$ |
0.28 |
|
|
$ |
0.05 |
|
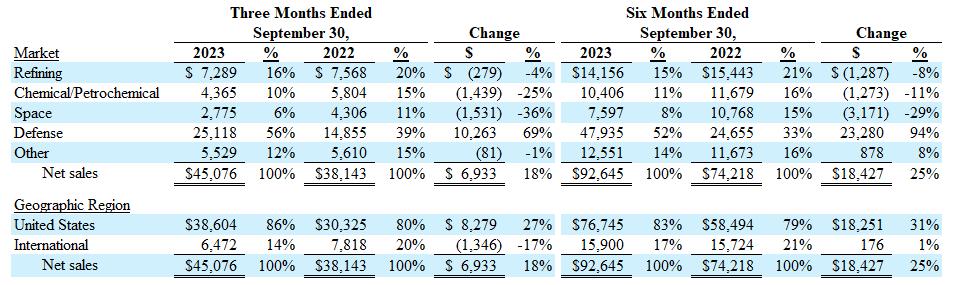
The following tables provide our net sales by product line and geographic region including the percentage of total and change in comparison to the prior year for each category and period presented:
The Second Quarter and First Six Months of Fiscal 2024 Compared with the Second Quarter and First Six Months of Fiscal 2023
Net sales for the second quarter of fiscal 2024 were $45,076, up $6,933, or 18% compared with $38,143 for the second quarter of fiscal 2023. This increase over the prior year was primarily due to sales to the defense industry, which increased $10,263 versus the prior year period primarily due to an improved mix of higher margin defense projects, increased direct labor, better execution, the timing of material receipts, and improved pricing. Net sales for the quarter also benefited from continued growth in commercial aftermarket of approximately $4,500 in comparison to the prior year period, which is included in our refining and chemical/petrochemical markets. Partially offsetting this increase were a $1,439 decline in chemical/petrochemical sales and a $1,531 decline in space sales primarily due to the timing of projects, as well as the loss of Virgin Orbit as a customer in April 2023 due to its Chapter 11 bankruptcy.
Domestic sales as a percentage of aggregate sales were 86% in the second quarter of fiscal 2024 compared with 80% in the second quarter of fiscal 2023, reflecting the increase in our defense industry businesses, which is U.S. based. Sales in the three months ended September 30, 2023 were 56% to the defense industry compared to 39% for the comparable quarter in fiscal 2023. Fluctuation in sales among markets, products and geographic locations varies, sometimes significantly, from quarter-to-quarter based on timing and magnitude of projects but overall reflects our strategic shift towards the defense industry.
Net sales for the first six months of fiscal 2024 were $92,645, an increase of $18,427 or 25% from the first six months of fiscal 2023 and were primarily in the defense market. Additionally, our sales continued to benefit from our diversified revenue base including strong growth of approximately $7,625 in commercial aftermarket sales which is included in our refining and chemical/petrochemical markets. Partially offsetting this increase was a $3,171 decline in space sales primarily due to the timing of projects, as well as the loss of Virgin Orbit as a customer in April 2023 due to its Chapter 11 bankruptcy. Sales in the six months ended September 30, 2023 were
20
52% for the defense industry compared with 33% for the defense industry in the comparable period in fiscal 2023 and reflects our strategic shift towards the defense industry. See also "Current Market Conditions," above. For additional information on anticipated future sales and our markets, see "Orders and Backlog" below.
Gross profit margin for the second quarter of fiscal 2024 was 16%, compared with 14% for the second quarter of fiscal 2023. Gross profit for the second quarter of fiscal 2024 increased $1,911, or 36%, compared with fiscal 2023, to $7,191. These increases reflected the increase in sales discussed above as well as an improved mix of sales related to higher margin defense and commercial aftermarket, as well as better execution and pricing on defense contracts, partially offset by higher incentive compensation in comparison with the prior year.
Gross profit margin for the first six months of fiscal 2024 was 20%, compared with 16% for the first six months of fiscal 2023. Gross profit for the first six months of fiscal 2024 increased $6,144 compared with fiscal 2023, to $18,168. These increases reflected the increase in sales discussed above as well as an improved mix of sales related to higher margin defense and commercial aftermarket sales, as well as better execution and pricing on defense contracts, partially offset by higher incentive compensation in comparison with the prior year.
SG&A expense including amortization for the second quarter of fiscal 2024 was $6,388 compared to $5,332 for the second quarter of fiscal 2023. Approximately $800 of this increase was due to the BN Performance Bonus. The remainder of the increase in SG&A expense primarily relates to cost increases due to inflation, as well as increased professional services of approximately $200 due to increasing complexity in our business associated with growth and our international operations. As a percentage of net sales, SG&A expense in the second quarter of fiscal 2024 remained consistent at 14% compared with the same period of fiscal 2023.
SG&A expense including amortization for the first six months of fiscal 2024 was $13,681, up $2,590 compared with $11,091 for the first six months of fiscal 2023. Approximately $1,600 of this increase was due to the BN Performance Bonus. The remainder of the increase in SG&A expense primarily relates to cost increases due to inflation, as well as increased professional services of approximately $350 due to increasing complexity in our business associated with growth and our international operations. As a percentage of net sales, SG&A expense in the first six months of fiscal 2024 remained consistent at 15% compared with the same period of fiscal 2023.
Net interest expense for the second quarter of fiscal 2024 was $55 compared to $246 in the second quarter of fiscal 2023. This decrease was due to lower net debt levels, partially offset by an increase in interest rates since the second quarter of fiscal 2023.
Net interest expense for the first six months of fiscal 2024 was $240 compared to $403 in the first six months of fiscal 2023. This decrease was due to lower net debt levels, partially offset by an increase in interest rates since the second quarter of fiscal 2023.
Our effective tax rate in the second quarter of fiscal 2024 was 37%, compared with 17% in the second quarter of fiscal 2023. Our effective tax rate for the first six months of fiscal 2024 was 25%, compared with 27% for the first six months of fiscal 2023. Our effective tax rate can vary significantly from period to period depending on the level of pre-tax income, the amount of income derived from our higher tax rate foreign subsidiaries, as well as the timing of discrete tax items, primarily related to the vesting of restricted stock awards. For fiscal 2024 we expect our full year effective tax rate to be 22% to 23%.
The net result of the above is that net income and income per diluted share for the second quarter of fiscal 2024 were $411 and $0.04, respectively, compared with a loss of $196 and $0.02, respectively, for the second quarter of fiscal 2023. Adjusted net income and adjusted net income per diluted share for the second quarter of fiscal 2024 were $1,371 and $0.13, respectively, compared with net income of $325 and $0.03, respectively, for the second quarter of fiscal 2023.
Net income and income per diluted share for the first six months of fiscal 2024 were $3,051 and $0.28, respectively, compared with net income of $480 and $0.05, respectively, for the first six months of fiscal 2023. Adjusted net income and adjusted net income per diluted share for the first six months of fiscal 2024 were $4,945 and $0.46, respectively, compared with net income of $1,654 and $0.16, respectively, for the first six months of fiscal 2023. See "Non-GAAP Measures" below for a reconciliation of adjusted net income and adjusted net income per diluted share to the comparable GAAP amount.
Non-GAAP Measures
Adjusted earnings before net interest expense, income taxes, depreciation and amortization ("EBITDA"), adjusted net income, and adjusted net income per diluted share are provided for information purposes only and are not measures of financial performance under accounting principles generally accepted in the U.S. ("GAAP"). Management believes the presentation of these financial measures reflecting non-GAAP adjustments provides important supplemental information to investors and other users of our financial statements in evaluating the operating results of the Company. In particular, those charges and credits that are not directly related to operating performance, and that are not a helpful measure of the performance of our underlying business particularly in light of their unpredictable
21
nature. These non-GAAP disclosures have limitations as analytical tools, should not be viewed as a substitute for net income or net income per diluted share determined in accordance with GAAP, and should not be considered in isolation or as a substitute for analysis of our results as reported under GAAP, nor are they necessarily comparable to non-GAAP performance measures that may be presented by other companies. In addition, supplemental presentation should not be construed as an inference that our future results will be unaffected by similar adjustments to net income or net income per diluted share determined in accordance with GAAP. Adjusted EBITDA, adjusted net income and adjusted net income per diluted share are key metrics used by management and our board of directors to assess the Company’s financial and operating performance and adjusted EBITDA is a basis for a portion of management's performance-based compensation.
Adjusted EBITDA excludes charges for depreciation, amortization, interest expense, taxes, other acquisition related expenses, the BN Performance Bonus, and other unusual/nonrecurring expenses. Adjusted net income and adjusted net income per diluted share excludes intangible amortization, the BN Performance Bonus, other costs related to the acquisition, and other unusual/nonrecurring expenses.
A reconciliation of adjusted EBITDA, adjusted net income and adjusted net income per diluted share to net income (loss) in accordance with GAAP is as follows:
|
Three Months Ended |
|
|
Six Months Ended |
|
||||||||||
|
September 30, |
|
|
September 30, |
|
||||||||||
|
2023 |
|
|
2022 |
|
|
2023 |
|
|
2022 |
|
||||
Net income (loss) |
$ |
411 |
|
|
$ |
(196 |
) |
|
$ |
3,051 |
|
|
$ |
480 |
|
Acquisition & integration costs |
|
- |
|
|
|
- |
|
|
|
- |
|
|
|
54 |
|
BN Performance Bonus |
|
802 |
|
|
|
- |
|
|
|
1,569 |
|
|
|
- |
|
Debt amendment costs |
|
- |
|
|
|
41 |
|
|
|
- |
|
|
|
194 |
|
Net interest expense |
|
55 |
|
|
|
246 |
|
|
|
240 |
|
|
|
403 |
|
Income taxes |
|
243 |
|
|
|
(40 |
) |
|
|
1,009 |
|
|
|
175 |
|
Depreciation & amortization |
|
1,201 |
|
|
|
1,487 |
|
|
|
2,440 |
|
|
|
2,962 |
|
Adjusted EBITDA |
$ |
2,712 |
|
|
$ |
1,538 |
|
|
$ |
8,309 |
|
|
$ |
4,268 |
|
Adjusted EBITDA as a % of revenue |
|
6.0 |
% |
|
|
4.0 |
% |
|
|
9.0 |
% |
|
|
5.8 |
% |
|
Three Months Ended |
|
|
Six Months Ended |
|
||||||||||
|
September 30, |
|
|
September 30, |
|
||||||||||
|
2023 |
|
|
2022 |
|
|
2023 |
|
|
2022 |
|
||||
Net income (loss) |
$ |
411 |
|
|
$ |
(196 |
) |
|
$ |
3,051 |
|
|
$ |
480 |
|
Acquisition & integration costs |
|
- |
|
|
|
- |
|
|
|
- |
|
|
|
54 |
|
Amortization of intangible assets |
|
445 |
|
|
|
619 |
|
|
|
891 |
|
|
|
1,238 |
|
BN Performance Bonus |
|
802 |
|
|
|
- |
|
|
|
1,569 |
|
|
|
- |
|
Debt amendment costs |
|
- |
|
|
|
41 |
|
|
|
- |
|
|
|
194 |
|
Normalize tax rate(1) |
|
(287 |
) |
|
|
(139 |
) |
|
|
(566 |
) |
|
|
(312 |
) |
Adjusted net income |
$ |
1,371 |
|
|
$ |
325 |
|
|
$ |
4,945 |
|
|
$ |
1,654 |
|
|
|
|
|
|
|
|
|
|
|
|
|
||||
GAAP net income (loss) per diluted share |
$ |
0.04 |
|
|
$ |
(0.02 |
) |
|
$ |
0.28 |
|
|
$ |
0.05 |
|
Adjusted net income per diluted share |
$ |
0.13 |
|
|
$ |
0.03 |
|
|
$ |
0.46 |
|
|
$ |
0.16 |
|
Diluted weighted average common shares outstanding |
|
10,810 |
|
|
|
10,617 |
|
|
|
10,761 |
|
|
|
10,618 |
|
|
|
|
|
|
|
|
|
|
|
|
|
||||
(1) Applies a normalized tax rate to non-GAAP adjustments, which are pre-tax, based upon the statutory tax rate of 23%. |
|
||||||||||||||
|
|
|
|
|
|
|
|
|
|
|
|
||||
22
Liquidity and Capital Resources
The following discussion should be read in conjunction with our Condensed Consolidated Balance Sheets and Condensed Consolidated Statements of Cash Flows:
|
|
September 30, |
|
|
March 31, |
|
||
|
|
2023 |
|
|
2023 |
|
||
Cash and cash equivalents |
|
$ |
25,800 |
|
|
$ |
18,257 |
|
Working capital (1) |
|
|
26,275 |
|
|
|
23,904 |
|
Working capital ratio(1) |
|
|
1.3 |
|
|
|
1.3 |
|
Net cash provided by operating activities for the first six months of fiscal 2024 was $11,898 compared with $398 of cash used for the first six months of fiscal 2023. The cash provided by operations during the first six months of fiscal 2024 was higher than the comparable prior year period primarily as a result of higher cash net income and a reduction in working capital as a result of the change in payment terms related to a large defense customer during the quarter and increased customer deposits.
Capital expenditures for fiscal 2024 are expected to be approximately $12,000 to $13,500 and include approximately $5,500 related to the expansion of production capabilities at our Batavia facility, which is being funded by one of our defense customers. Fiscal 2024 capital expenditures are expected to be primarily for machinery and equipment, as well as for buildings and leasehold improvements to fund our growth and productivity improvement initiatives. The majority of our planned capital expenditures are discretionary. We estimate that our maintenance capital spend is approximately $2,000 per year.
Cash and cash equivalents were $25,800 at September 30, 2023 compared with $18,257 at March 31, 2023, up $7,543 primarily due to cash provided by operations, offset by capital expenditures and debt repayments. At September 30, 2023, approximately $7,000 of our cash and cash equivalents was used to secure our letters of credit and approximately $2,100 of our cash was held by foreign subsidiaries.
On October 13, 2023, we terminated the revolving credit facility and repaid our term loan with Bank of America, and entered into a new five-year revolving credit facility with Wells Fargo that provides a $35,000 line of credit, including letters of credit and bank guarantees, expandable up to $50,000 upon our satisfying specified covenants (the "New Revolving Credit Facility"). The additional $15,000 will automatically be available upon (i) our achieving a minimum consolidated EBITDA, as defined in the agreement, of $15,000, computed on a trailing twelve month basis, for three consecutive quarters and (ii) a minimum liquidity (consisting of cash and borrowing availability under the New Revolving Credit Facility) of at least $7,500. In addition to the $25,000 letters of credit available to be issued pursuant to the New Revolving Credit Facility, we may request the issuance of cash secured letters of credit in an aggregate amount of up to $7,500.
The New Revolving Credit Facility contains customary terms and conditions, including representations and warranties and affirmative and negative covenants, as well as financial covenants for the benefit of Wells Fargo, which require us to maintain (i) a consolidated total leverage ratio not to exceed 3.50:1.00 and (ii) a consolidated fixed charge coverage ratio of at least 1.20:1.00, in both cases computed in accordance with the definitions and requirements specified in the New Revolving Credit Facility.
Borrowings under the New Revolving Credit Facility bear interest at a rate equal to, at our option, either (i) a forward-looking term rate based on the secured overnight financing rate ("SOFR") for the applicable interest period, subject to a floor of 0.0% per annum or (ii) a base rate determined by reference to the highest of (a) the rate of interest per annum publicly announced by Wells Fargo as its prime rate, (b) the federal funds rate plus 0.50% per annum and (c) one-month term SOFR plus 1.00% per annum, subject to a floor of 1.00% per annum, plus, in each case, an applicable margin. The applicable margins range between (i) 1.25% per annum and 2.50% per annum in the case of any term SOFR loan and (ii) 0.25% per annum and 1.50% per annum in the case of any base rate loan, in each case based upon our then-current consolidated total leverage ratio; provided, however, for a period of one year following the closing date, the applicable margin shall be set at 1.25% per annum in the case of any term SOFR loan and 0.25% per annum in the case of any base rate loan.
We will incur a quarterly commitment fee on the unused portion of the New Revolving Credit Facility during the applicable quarter at a per annum rate also determined by reference to our then-current consolidated total leverage ratio, which fee ranges between 0.10% per annum and 0.20% per annum; provided, however, for a period of one year following the closing date, the quarterly commitment fee will be set at 0.10% per annum. Any outstanding letters of credit that are cash secured will bear a fee equal to the daily amount available to be drawn under such letters of credit multiplied by 0.65% per annum. Any outstanding letters of credit issued under
23
the New Revolving Credit Facility will bear a fee equal to the daily amount drawn under such letters of credit multiplied by the applicable margin for term SOFR loans.
In connection with the termination of our prior revolving credit facility, we repaid the $725 exit fee and recognized an extinguishment charge of approximately $650 from our previous lending agreement amendments.
We did not have any off-balance sheet arrangements as of September 30, 2023 and 2022, other than letters of credit incurred in the ordinary course of business.
We believe that cash generated from operations combined with the liquidity provided by our New Revolving Credit Facility will be adequate to meet our cash needs and fund our long-term strategic growth objectives.
Orders and Backlog
In addition to the non-GAAP measures discussed above, management uses the following key performance metrics to analyze and measure the Company's financial performance and results of operations: orders, backlog, and book-to-bill ratio. Management uses orders and backlog as measures of current and future business and financial performance and these may not be comparable with measures provided by other companies. Orders represent written communications received from customers requesting us to provide products and/or services. Backlog is defined as the total dollar value of net orders received for which revenue has not yet been recognized. Management believes tracking orders and backlog are useful as it often times is a leading indicator of future performance. In accordance with industry practice, contracts may include provisions for cancellation, termination, or suspension at the discretion of the customer.
The book-to-bill ratio is an operational measure that management uses to track the growth prospects of the Company. The Company calculates the book-to-bill ratio for a given period as net orders divided by net sales.
Given that each of orders, backlog and book-to-bill ratio is an operational measure and that the Company's methodology for calculating these measures does not meet the definition of a non-GAAP measure, as that term is defined by the SEC, a quantitative reconciliation for each is not required or provided.
The following tables provides our orders by market and geographic region including the percentage of total and change in comparison to the prior year for each category and period presented:
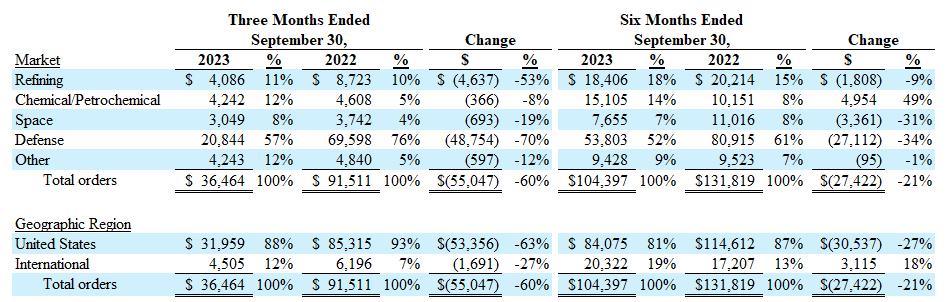
Orders booked for the three-month period ended September 30, 2023 were $36,464, a decrease of $55,047 over the comparable period of fiscal 2023. Orders booked for the six-month period ended September 30, 2023 were $104,397, a decrease of $27,422 over the comparable period of fiscal 2023. These decreases were primarily due to the timing of our large defense orders and orders to the refining market. For the six-month period ended September 30, 2023, our book-to-bill ratio was 1.1x. Orders during the first six months of 2024 included the following:
24
We believe the repeat U.S. Navy orders and strategic investment received validates the investments we made, our position as a key supplier to the defense industry and our customer's confidence in our execution. Additionally, we believe the strong aftermarket orders are significant because they historically have been a leading indicator of a cyclical upturn in capital project orders. However, we do not expect the next cycle to be as robust as years past due to the factors discussed above under "Current Market Conditions."
Orders to the U.S. represented 88% of total orders for the second quarter of fiscal 2024 compared to 93% in the second quarter of the prior year. These orders were primarily to the defense market which represented 57% of orders and are U.S. based.
Following the end of the second quarter of fiscal 2024, we announced that we received approximately $110 million in total orders in October 2023, which were primarily related to follow-on orders for critical U.S. Navy programs. These defense orders are expected to be recognized in revenue beginning in the fourth quarter of fiscal 2025 through early fiscal 2030.
The following table provides our backlog by market, including the percentage of total backlog, for each category and period presented:
|
|
September 30, |
|
|
|
|
September 30, |
|
|
|
Change |
|
|||||||||
Market |
|
2023 |
|
% |
|
|
2022 |
|
% |
|
$ |
|
|
% |
|
||||||
Refining |
|
$ |
29,116 |
|
|
9 |
% |
|
$ |
28,502 |
|
|
9 |
% |
$ |
614 |
|
|
|
2 |
% |
Chemical/Petrochemical |
|
|
13,705 |
|
|
5 |
% |
|
|
12,549 |
|
|
5 |
% |
|
1,156 |
|
|
|
9 |
% |
Space |
|
|
7,263 |
|
|
2 |
% |
|
|
13,210 |
|
|
4 |
% |
|
(5,947 |
) |
|
|
-45 |
% |
Defense |
|
|
250,732 |
|
|
80 |
% |
|
|
248,672 |
|
|
79 |
% |
|
2,060 |
|
|
|
1 |
% |
Other |
|
|
12,527 |
|
|
4 |
% |
|
|
10,407 |
|
|
3 |
% |
|
2,120 |
|
|
|
20 |
% |
Total backlog |
|
$ |
313,343 |
|
|
100 |
% |
|
$ |
313,340 |
|
|
100 |
% |
$ |
3 |
|
|
|
0 |
% |
Backlog was $313,343 at September 30, 2023, which is consistent with the prior year period. We expect to recognize revenue on approximately 50% of the backlog within one year, 25% to 30% in one to two years and the remaining beyond two years. The majority of the orders that are expected to convert beyond twenty-four months are for the defense industry, specifically the U.S. Navy that have a long conversion cycle (generally up to six years). During the second quarter of fiscal 2024, we shipped the last of the first article units related to the Columbia Class submarine and Ford Class carrier programs. While we expect to continue to have first article programs in our backlog as we win new programs and applications, the amount as a percentage of total backlog should be reduced moving forward. During fiscal 2022, we chose to make significant investments to ensure we could deliver these and previous units on schedule and these investments were the main source of the losses incurred that year.
Outlook
We are providing the following fiscal 2024 outlook reflecting our current expectations:
Net Sales |
|
$170 million to $180 million |
Gross Profit |
|
18% to 19% of sales |
SG&A Expenses(1) |
|
15% to 16% of sales |
Tax Rate |
|
22% to 23% |
Adjusted EBITDA(2) |
|
$11.5 million to $13.5 million |
|
|
|
(1) Includes approximately $2.5 million to $4 million of BN Performance Bonus and ERP conversion costs included in SG&A expense. |
||
(2) Excludes approximately $2.5 million to $4 million of BN Performance Bonus and ERP conversion costs included in SG&A expense and approximately $0.7 million of debt extinguishment charges. |
||
See "Cautionary Note Regarding Forward-Looking Statement" and "Non-GAAP Measures" above for additional information about forward-looking statements and non-GAAP measures. We have not reconciled non-GAAP forward-looking Adjusted EBITDA to its most directly comparable GAAP measure, as permitted by Item 10(e)(1)(i)(B) of Regulation S-K. Such reconciliation would require unreasonable efforts to estimate and quantify various necessary GAAP components largely because forecasting or predicting our future operating results is subject to many factors out of our control or not readily predictable.
25
We have made significant progress with the advancements in our business, which we believe puts us on schedule in achieving our fiscal 2027 goals of greater than $200,000 in revenue (8% to 10% average annualized revenue growth) and Adjusted EBITDA margins in the low to mid-teens.
Our expectations for sales and profitability assume that we will be able to operate our production facilities at planned capacity, have access to our global supply chain including our subcontractors, do not experience significant global health related disruptions, and assumes no further impact from Virgin Orbit or any other unforeseen events.
Contingencies and Commitments
We have been named as a defendant in lawsuits alleging personal injury from exposure to asbestos allegedly contained in or accompanying our products. We are a co-defendant with numerous other defendants in these lawsuits and intend to vigorously defend ourselves against these claims. The claims in our current lawsuits are similar to those made in previous asbestos lawsuits that named us as a defendant. Such previous lawsuits either were dismissed when it was shown that we had not supplied products to the plaintiffs’ places of work, or were settled by us for immaterial amounts.
As of September 30, 2023, we are subject to the claims noted above, as well as other legal proceedings and potential claims that have arisen in the ordinary course of business. Although the outcome of the lawsuits, legal proceedings or potential claims to which we are or may become a party cannot be determined and an estimate of the reasonably possible loss or range of loss cannot be made for the majority of the claims, we do not believe that the outcomes, either individually or in the aggregate, will have a material adverse effect on our results of operations, financial position or cash flows.
Critical Accounting Policies, Estimates, and Judgments
Our unaudited condensed consolidated financial statements are based on the selection of accounting policies and the application of significant accounting estimates, some of which require management to make significant assumptions. We believe that the most critical accounting estimates used in the preparation of our condensed consolidated financial statements relate to labor hour estimates, total cost, and establishment of operational milestones which are used to recognize revenue over time, accounting for contingencies, under which we accrue a loss when it is probable that a liability has been incurred and the amount can be reasonably estimated, accounting for business combinations and intangible assets, and accounting for pensions and other postretirement benefits. For further information, refer to Item 7 "Management's Discussion and Analysis of Financial Condition and Results of Operations" and Item 8 "Financial Statements and Supplementary Data" included in our Annual Report on Form 10-K for the year ended March 31, 2023.
Item 3. Quantitative and Qualitative Disclosures About Market Risk
The principal market risks (i.e., the risk of loss arising from market changes) to which we are exposed are foreign currency exchange rates, price risk, and interest rate risk.
The assumptions applied in preparing the following qualitative and quantitative disclosures regarding foreign currency exchange rate, price risk and interest rate risk are based upon volatility ranges experienced by us in relevant historical periods, our current knowledge of the marketplace, and our judgment of the probability of future volatility based upon the historical trends and economic conditions of the markets in which we operate.
Foreign Currency
International consolidated sales for the first six months of fiscal 2024 were 17% of total sales compared with 21% for the same period of fiscal 2023. Operating in markets throughout the world exposes us to movements in currency exchange rates. Currency movements can affect sales in several ways, the foremost being our ability to compete for orders against foreign competitors that base their prices on relatively weaker currencies. Business lost due to competition for orders against competitors using a relatively weaker currency cannot be quantified. In addition, cash can be adversely impacted by the conversion of sales made by us in a foreign currency to U.S. dollars. In each of the first six months of fiscal 2024 and fiscal 2023, substantially all sales by us and our wholly-owned subsidiaries, for which we were paid, were denominated in the local currency of the respective subsidiary (U.S. dollars, Chinese RMB or India INR). For the first six months of fiscal 2024, foreign currency exchange rate fluctuations reduced our cash balances by $82 primarily due to the strengthening of the U.S. dollar.
We have limited exposure to foreign currency purchases. In the first six months of fiscal 2024, our purchases in foreign currencies represented approximately 3% of the cost of products sold. At certain times, we may enter into forward foreign currency exchange
26
agreements to hedge our exposure against potential unfavorable changes in foreign currency values on significant sales and purchase contracts negotiated in foreign currencies. Forward foreign currency exchange contracts were not used in the periods being reported in this Form 10-Q and as of September 30, 2023 and March 31, 2023, we held no forward foreign currency contracts.
Price Risk
Operating in a global marketplace requires us to compete with other global manufacturers which, in some instances, benefit from lower production costs and more favorable economic conditions. Although we believe that our customers differentiate our products on the basis of our manufacturing quality, engineering experience, and customer service, among other things, such lower production costs and more favorable economic conditions mean that our competitors are able to offer products similar to ours at lower prices. In extreme market downturns, such as we recently experienced, we typically see depressed price levels. Additionally, we have faced, and may continue to face, significant cost inflation, specifically in labor costs, raw materials, and other supply chain costs due to increased demand for raw materials and resources caused by the broad disruption of the global supply chain, including those associated with the impact of COVID-19. International conflicts or other geopolitical events, including the 2022 Russian invasion of Ukraine and the Israel-Hamas war, may further contribute to increased supply chain costs due to shortages in raw materials, increased costs for transportation and energy, disruptions in supply chains, and heightened inflation. Further escalation of geopolitical tensions may also lead to changes to foreign exchange rates and financial markets, any of which may adversely affect our business and supply chain, and consequently our results of operation. While there could ultimately be a material impact on our operations and liquidity, at the time of this report, the impact could not be determined.
Interest Rate Risk
As a result of the BN acquisition and in order to fund our strategic growth objectives we borrow funds under our various credit agreements that bear interest at a variable rate. As part of our risk management activities, we evaluate the use of interest rate derivatives to add stability to interest expense and to manage our exposure to interest rate movements. As of September 30, 2023, we had $11,500 of variable rate debt outstanding on our revolving credit facility and no interest rate derivatives outstanding. See ''Debt'' in Note 12 to the Unaudited Condensed Consolidated Financial Statements included in Item 1 of this Quarterly Report on Form 10-Q for additional information about our outstanding debt. A hypothetical one percentage point (100 basis points) change in the BSBY rate on the $11,500 of variable rate debt outstanding at September 30, 2023 would have an impact of approximately $115 on our interest expense for fiscal 2024.
Item 4. Controls and Procedures
Conclusion regarding the effectiveness of disclosure controls and procedures
Our President and Chief Executive Officer (our principal executive officer) and Vice President - Finance and Chief Financial Officer (our principal financial officer) each have evaluated the effectiveness of our disclosure controls and procedures (as defined in Exchange Act Rules 13a-15(e) and 15d-15(e)) as of the end of the period covered by this Quarterly Report on Form 10-Q. Based on such evaluation, and as of such date, our President and Chief Executive Officer and Vice President - Finance and Chief Financial Officer concluded that our disclosure controls and procedures were effective in all material respects.
Changes in internal control over financial reporting
There has been no change to our internal control over financial reporting during the quarter covered by this Quarterly Report on Form 10-Q that has materially affected, or that is reasonably likely to materially affect, our internal control over financial reporting. We have not experienced any material impact to our internal controls over financial reporting.
27
PART II - OTHER INFORMATION
Item 1A. Risk Factors
There have been no material changes from the risk factors previously disclosed in Part 1 – Item 1A of the Company’s Form 10-K for the fiscal year ended March 31, 2023.
Item 2: Unregistered Sales of Equity Securities, Use of Proceeds, and Issuer Purchases of Equity Securities
Dividend Policy
We do not currently pay a cash dividend on our common stock. Any future determination by our board of directors regarding dividends will depend on a variety of factors, including our compliance with the terms of the credit agreement, organic growth and acquisition opportunities, future financial performance, general economic conditions and financial, competitive, regulatory, and other factors, many of which are beyond our control. There can be no guarantee that we will pay dividends in the future.
28
Item 6. Exhibits
INDEX OF EXHIBITS
(10) |
|
Material Contracts |
|
|
|
|
|
|
|
+# |
|
10.1 |
||
|
|
|
|
|
|
|
10.2 |
||
|
|
|
|
|
# |
|
10.3 |
||
(31) |
|
Rule 13a-14(a)/15d-14(a) Certifications |
||
|
|
|
|
|
+ |
|
31.1 |
||
|
|
|
|
|
+ |
|
31.2 |
||
|
|
|
|
|
(32) |
|
Section 1350 Certification |
||
|
|
|
|
|
++ |
|
32.1 |
||
|
|
|
|
|
(101) |
|
Interactive Data File |
||
|
|
|
|
|
+ |
|
101.INS |
Inline XBRL Instance Document – the instance document does not appear in the Interactive Data File because its XBRL tags are embedded within the Inline XBRL document. |
|
|
|
|
|
|
+ |
|
101.SCH |
Inline XBRL Taxonomy Extension Schema Document |
|
|
|
|
|
|
+ |
|
101.CAL |
Inline XBRL Taxonomy Extension Calculation Linkbase Document |
|
|
|
|
|
|
+ |
|
101.DEF |
Inline XBRL Taxonomy Extension Definition Linkbase Document |
|
|
|
|
|
|
+ |
|
101.LAB |
Inline XBRL Taxonomy Extension Label Linkbase Document |
|
|
|
|
|
|
+ |
|
101.PRE |
Inline XBRL Taxonomy Extension Presentation Linkbase Document |
|
|
|
|
|
|
(104) |
|
|
Cover Page Interactive Data File embedded within the Inline XBRL document
|
|
|
|
|
|
|
|
|
+ ++ # |
Exhibit filed with this report Exhibit furnished with this report Management contract or compensation plan |
|
29
SIGNATURES
Pursuant to the requirements of the Securities Exchange Act of 1934, the registrant has duly caused this report to be signed on its behalf by the undersigned thereunto duly authorized.
|
GRAHAM CORPORATION
|
||
By: |
|
|
/s/ CHRISTOPHER J. THOME |
|
|
|
Christopher J. Thome |
|
|
|
Vice President-Finance and |
|
|
|
Chief Financial Officer |
|
|
|
(On behalf of the Registrant and as Principal Financial Officer) |
Date: November 6, 2023
30