Exhibit 99.2 G r a h a m C o r p o r a t i o n Q4 FY2022 Teleconference June 9, 2022 Daniel J. Thoren, President and Chief Executive Officer Christopher J. Thome, Vice President - Finance and Chief Financial Officer www.GrahamCorp.com
Safe Harbor Statement This presentation contains forward-looking statements within the meaning of Section 27A of the Securities Act of 1933, as amended, and Section 21E of the Securities Exchange Act of 1934, as amended. Forward-looking statements are subject to risks, uncertainties and assumptions and are identified by words such as “expects,” “estimates,” “outlook,” “anticipates,” “believes,” “implies”, “could,” “opportunities,” “plans,” ”may,” “will,” and other similar words. All statements addressing operating performance, events, or developments that Graham Corporation expects or anticipates will occur in the future, including but not limited to, its dividend, any future waivers of financial covenants or compliance with the terms of its credit agreements, any amendments to its credit facility, its ability and the timing needed to address challenges in its defense business, including at the Batavia, NY operations, profitability of future projects, the development and impact of better documentation of build processes and pricing models, its ability to meet customers’ delivery expectations, the future impact of low margin defense projects and related cost overruns, anticipated capital contributions, the future expected contributions of BN, expected expansion and growth opportunities within its domestic and international markets, anticipated revenue, margins, adjusted EBITDA, adjusted EBITDA margins, and SG&A expenses, the timing of conversion of backlog to sales, market presence, profit margins, tax rates, foreign sales operations, its ability to improve cost competitiveness and productivity, customer preferences, changes in market conditions in the industries in which it operates, labor constraints, the effect on its business of volatility in commodities prices, including, but not limited to, changes in general economic conditions and customer behavior, forecasts regarding the timing and scope of the economic recovery in its markets, its acquisition and growth strategy and its operations in China, India and other international locations, are forward-looking statements. Because they are forward-looking, they should be evaluated in light of important risk factors and uncertainties. These risk factors and uncertainties are more fully described in Graham Corporation’s most recent Annual Report filed with the Securities and Exchange Commission, included under the heading entitled “Risk Factors.” Should one or more of these risks or uncertainties materialize or should any of Graham Corporation’s underlying assumptions prove incorrect, actual results may vary materially from those currently anticipated. In addition, undue reliance should not be placed on Graham Corporation’s forward-looking statements. Except as required by law, Graham Corporation disclaims any obligation to update or publicly announce any revisions to any of the forward-looking statements contained in this presentation. Use of Forward-Looking Non-GAAP Financial Measures Forward-looking adjusted EBITDA, adjusted EBITDA margin and adjusted diluted earnings per share are non-GAAP measures. The Company is unable to present a quantitative reconciliation of these forward-looking non-GAAP financial measures to their most directly comparable forward-looking GAAP financial measures because such information is not available, and management cannot reliably predict the necessary components of such GAAP measures without unreasonable effort largely because forecasting or predicting our future operating results is subject to many factors out of our control or not readily predictable. In addition, the Company believes that such reconciliations would imply a degree of precision that would be confusing or misleading to investors. The unavailable information could have a significant impact on the Company’s fiscal 2023 and future financial results. These non-GAAP financial measures are preliminary estimates and are subject to risks and uncertainties, including, among others, changes in connection with purchase accounting, quarter-end and year-end adjustments. Any variation between the Company’s actual results and preliminary financial data set forth in this presentation may be material. 2
Q4/FY22 Overview A Tale Of Two Businesses Acquisition Drives Growth; Revenue was $39.7 Million in Q4 FY22 and $122.8 Million in FY22 ▪ Acquired Barber-Nichols (BN) - specialty fluid and power technologies for the defense and space industries - June 2021 ▪ Drove 4Q22 and FY22 revenue growth of 55% and 26%, respectively. Margin performance met expectations ▪ Defense & Space revenue contributed 53% of total revenue in the quarter, and 55% for FY22 ▪ Defense & Space represented 51% of FY22 orders and 80% of FY22 backlog Graham Manufacturing – Legacy Energy Capex Business Shifting to More Navy/Defense Contribution ▪ Legacy Refining and Petrochemical end markets declined due to impacts of COVID lockdowns and the shift towards renewable energy ▪ First article issues and hiring challenges impacted overall profitability but commitment to meet critical Navy delivery schedules improved our standing with key defense customers ▪ Corrective actions taken and showing progress ▪ Large installed global base yields strong aftermarket opportunities 3
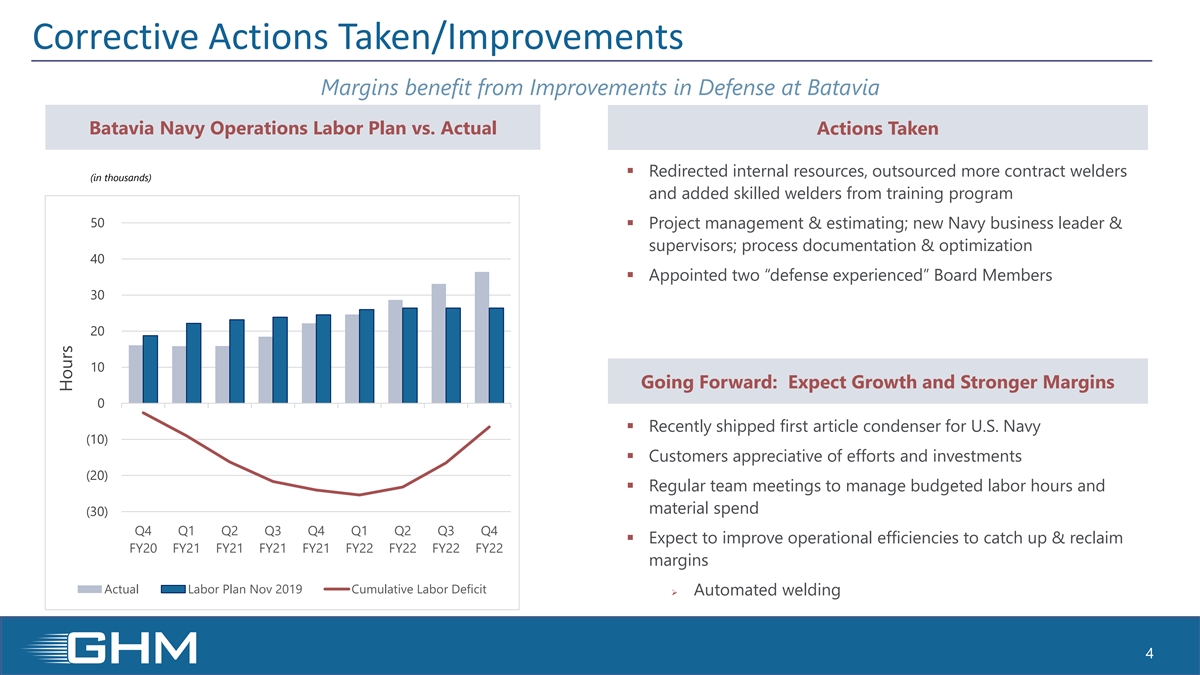
Corrective Actions Taken/Improvements Margins benefit from Improvements in Defense at Batavia Batavia Navy Operations Labor Plan vs. Actual Actions Taken ▪ Redirected internal resources, outsourced more contract welders (in thousands) and added skilled welders from training program 50 ▪ Project management & estimating; new Navy business leader & supervisors; process documentation & optimization 40 ▪ Appointed two “defense experienced” Board Members 30 20 10 Going Forward: Expect Growth and Stronger Margins 0 ▪ Recently shipped first article condenser for U.S. Navy (10) ▪ Customers appreciative of efforts and investments (20) ▪ Regular team meetings to manage budgeted labor hours and material spend (30) Q4 Q1 Q2 Q3 Q4 Q1 Q2 Q3 Q4 ▪ Expect to improve operational efficiencies to catch up & reclaim FY20 FY21 FY21 FY21 FY21 FY22 FY22 FY22 FY22 margins Actual Labor Plan Nov 2019 Cumulative Labor Deficit ➢ Automated welding 4 Hours
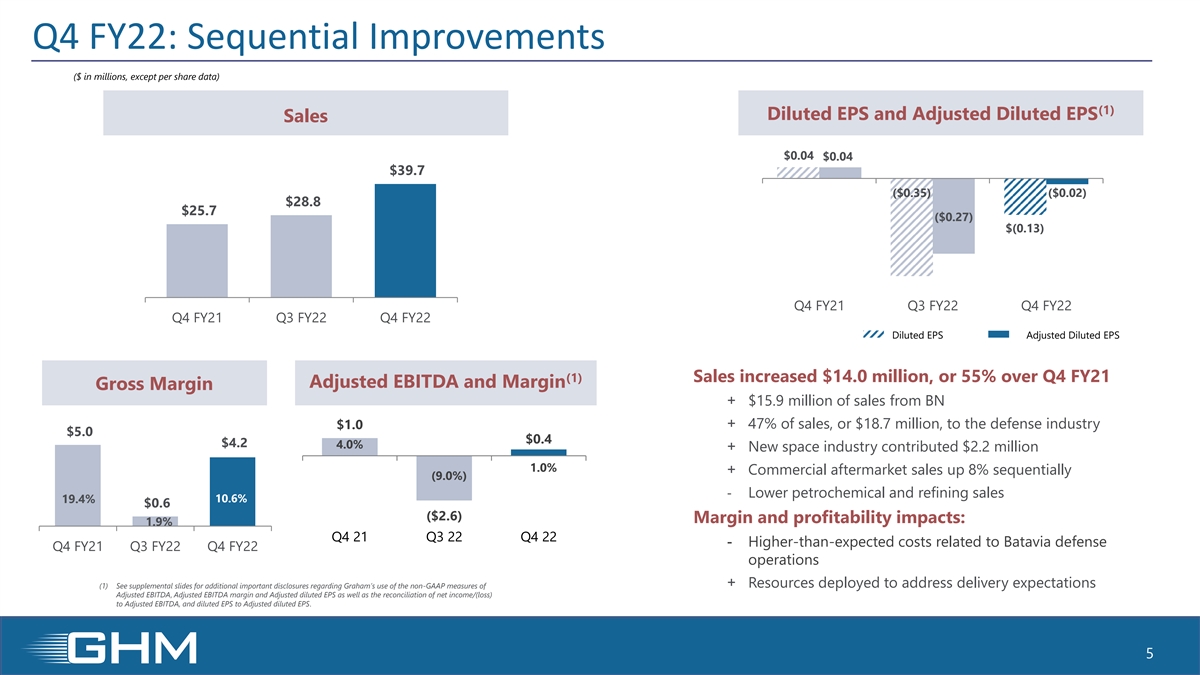
Q4 FY22: Sequential Improvements ($ in millions, except per share data) (1) Diluted EPS and Adjusted Diluted EPS Sales $0.04 $0.04 $39.7 ($0.35) ($0.02) $28.8 $25.7 ($0.27) $(0.13) Q4 FY21 Q3 FY22 Q4 FY22 6.7% Q4 FY21 Q3 FY22 Q4 FY22 Diluted EPS Adjusted Diluted EPS (1) Sales increased $14.0 million, or 55% over Q4 FY21 Adjusted EBITDA and Margin Gross Margin + $15.9 million of sales from BN + 47% of sales, or $18.7 million, to the defense industry $1.0 $5.0 $0.4 $4.2 4.0% + New space industry contributed $2.2 million 1.0% + Commercial aftermarket sales up 8% sequentially (9.0%) - Lower petrochemical and refining sales 10.6% 19.4% 1.0% $0.6 ($2.6) Margin and profitability impacts: 1.9% Q4 21 Q3 22 Q4 22 - Higher-than-expected costs related to Batavia defense Q4 FY21 Q3 FY22 Q4 FY22 operations + Resources deployed to address delivery expectations (1) See supplemental slides for additional important disclosures regarding Graham’s use of the non-GAAP measures of Adjusted EBITDA, Adjusted EBITDA margin and Adjusted diluted EPS as well as the reconciliation of net income/(loss) to Adjusted EBITDA, and diluted EPS to Adjusted diluted EPS. 5

FY2022: Strategic Diversification into Defense ($ in millions, except per share data) (1) Sales Adjusted EBITDA and Margin $5.1 $122.8 5.2% $97.5 $(5.0) (4.1%) FY 2021 FY 2022 FY 2021 FY 2022 Sales increased 26% driven by defense industry + $47.9 million of sales from BN; 51% of revenue related to (1) Gross Margin Diluted EPS & Adjusted Diluted EPS defense industry, up 2.6x + Space became a meaningful contributor $20.5 + Commercial aftermarket orders and sales expanded – $0.24 $0.24 leading indicator of future energy capex ($0.62) $9.1 - Lower petrochemical and refining sales – primarily in Asia 21.0% 7.4% ($0.83) Margin and profitability impacts: FY 2021 FY 2022 - Timing of lower margin defense projects FY 2021 FY 2022 Diluted EPS Adjusted Diluted EPS + Space became a meaningful contributor (1) See supplemental slides for additional important disclosures regarding Graham’s use of the non-GAAP measures of Adjusted EBITDA, Adjusted EBITDA margin and Adjusted diluted EPS as well as the reconciliation of net income/(loss) + Increase in commercial aftermarket sales to Adjusted EBITDA and diluted EPS to Adjusted diluted EPS. 6
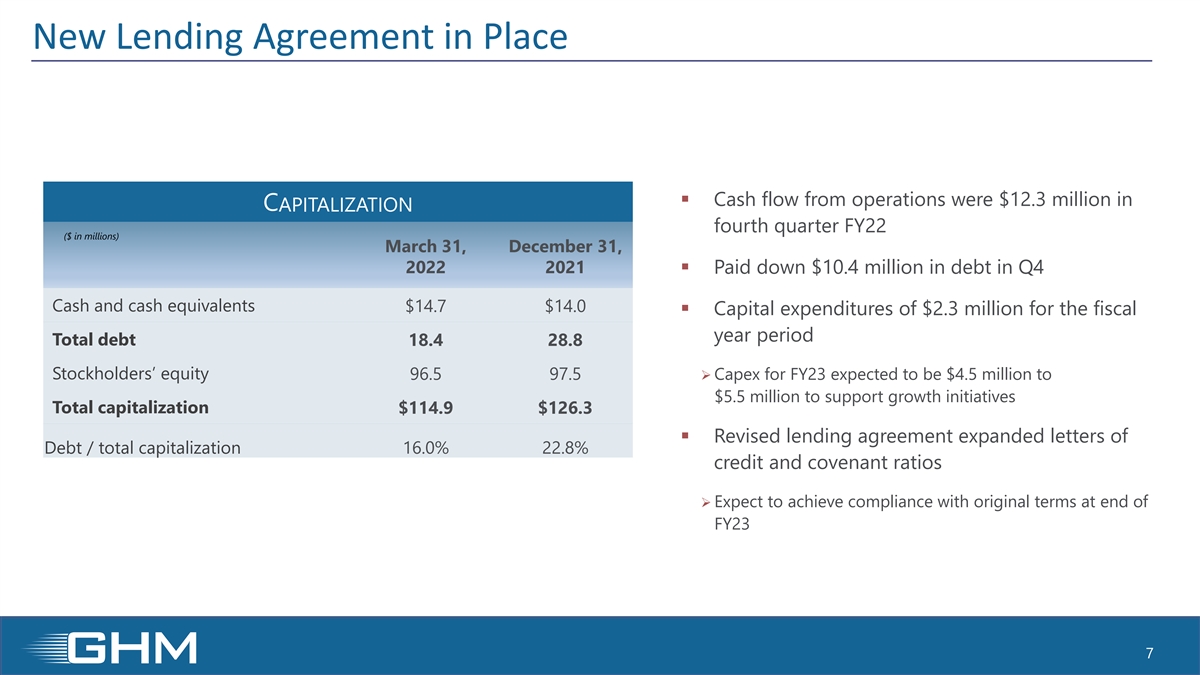
New Lending Agreement in Place ▪ Cash flow from operations were $12.3 million in CAPITALIZATION fourth quarter FY22 ($ in millions) March 31, December 31, 2022 2021▪ Paid down $10.4 million in debt in Q4 Cash and cash equivalents $14.7 $14.0 ▪ Capital expenditures of $2.3 million for the fiscal year period Total debt 18.4 28.8 Stockholders’ equity 96.5 97.5 ➢ Capex for FY23 expected to be $4.5 million to $5.5 million to support growth initiatives Total capitalization $114.9 $126.3 ▪ Revised lending agreement expanded letters of Debt / total capitalization 16.0% 22.8% credit and covenant ratios ➢ Expect to achieve compliance with original terms at end of FY23 7
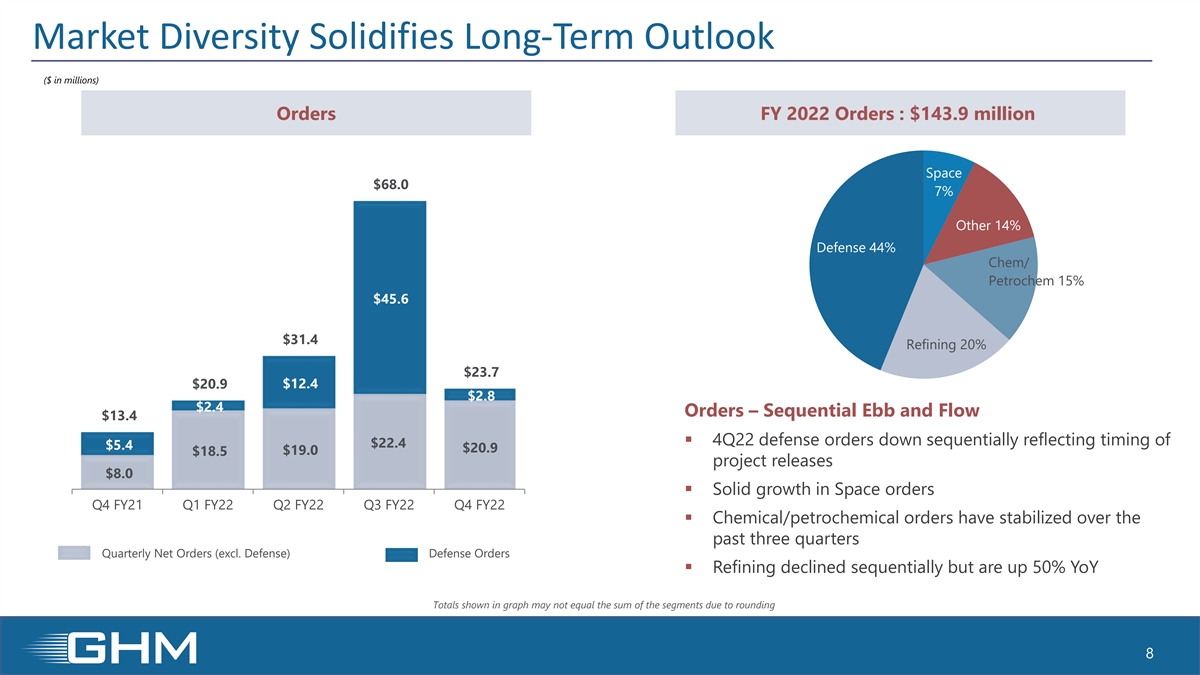
Market Diversity Solidifies Long-Term Outlook ($ in millions) Orders FY 2022 Orders : $143.9 million Space $68.0 7% Other 14% Defense 44% Chem/ Petrochem 15% $45.6 $31.4 Refining 20% $23.7 $20.9 $12.4 $2.8 $2.4 Orders – Sequential Ebb and Flow $13.4 ▪ 4Q22 defense orders down sequentially reflecting timing of $22.4 $5.4 $20.9 $19.0 $18.5 project releases $8.0 ▪ Solid growth in Space orders Q4 FY21 Q1 FY22 Q2 FY22 Q3 FY22 Q4 FY22 ▪ Chemical/petrochemical orders have stabilized over the past three quarters Quarterly Net Orders (excl. Defense) Defense Orders ▪ Refining declined sequentially but are up 50% YoY Totals shown in graph may not equal the sum of the segments due to rounding 8
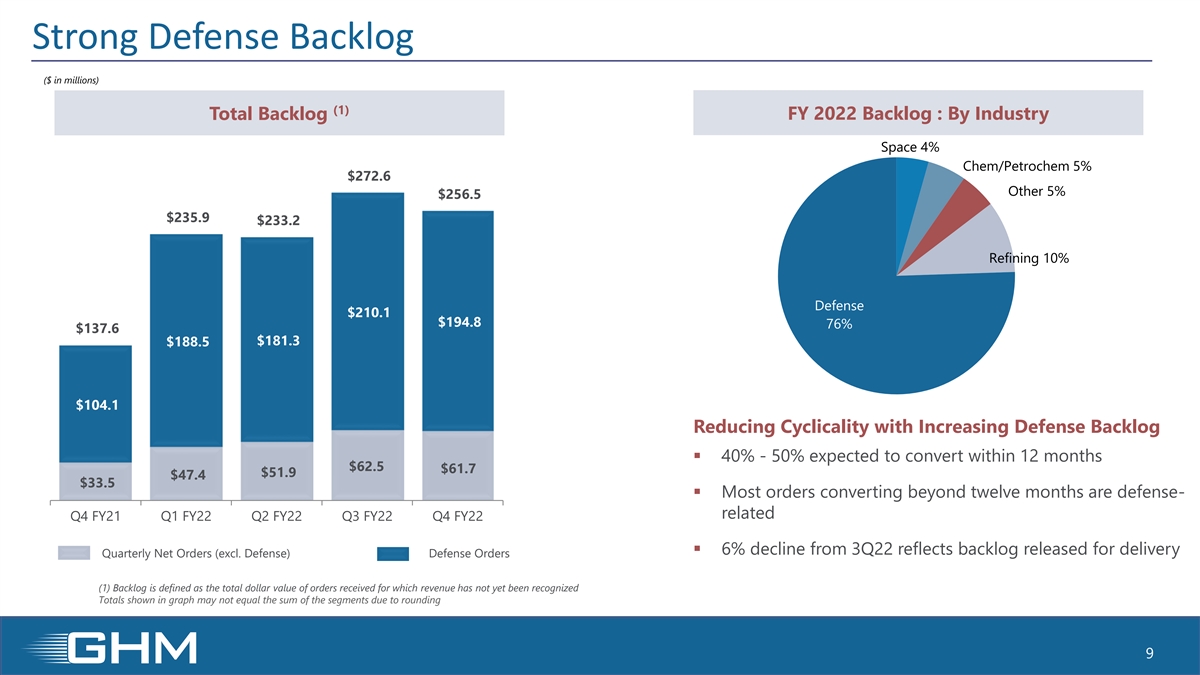
Strong Defense Backlog ($ in millions) (1) Total Backlog FY 2022 Backlog : By Industry Space 4% Chem/Petrochem 5% $272.6 Other 5% $256.5 $235.9 $233.2 Refining 10% Defense $210.1 $194.8 76% $137.6 $181.3 $188.5 $104.1 Reducing Cyclicality with Increasing Defense Backlog ▪ 40% - 50% expected to convert within 12 months $62.5 $61.7 $51.9 $47.4 $33.5 ▪ Most orders converting beyond twelve months are defense- related Q4 FY21 Q1 FY22 Q2 FY22 Q3 FY22 Q4 FY22 ▪ 6% decline from 3Q22 reflects backlog released for delivery Quarterly Net Orders (excl. Defense) Defense Orders (1) Backlog is defined as the total dollar value of orders received for which revenue has not yet been recognized Totals shown in graph may not equal the sum of the segments due to rounding 9
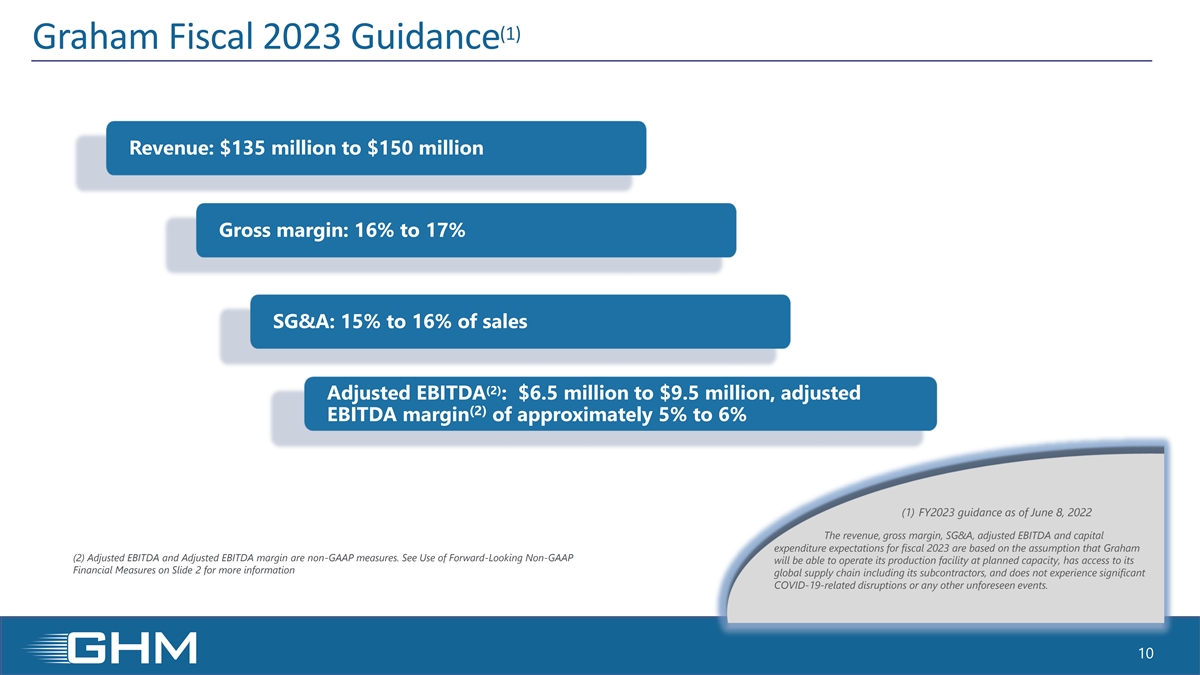
(1) Graham Fiscal 2023 Guidance Revenue: $135 million to $150 million Gross margin: 16% to 17% SG&A: 15% to 16% of sales (2) Adjusted EBITDA : $6.5 million to $9.5 million, adjusted (2) EBITDA margin of approximately 5% to 6% (1) FY2023 guidance as of June 8, 2022 The revenue, gross margin, SG&A, adjusted EBITDA and capital expenditure expectations for fiscal 2023 are based on the assumption that Graham (2) Adjusted EBITDA and Adjusted EBITDA margin are non-GAAP measures. See Use of Forward-Looking Non-GAAP will be able to operate its production facility at planned capacity, has access to its Financial Measures on Slide 2 for more information global supply chain including its subcontractors, and does not experience significant COVID-19-related disruptions or any other unforeseen events. 10
Supplemental Information
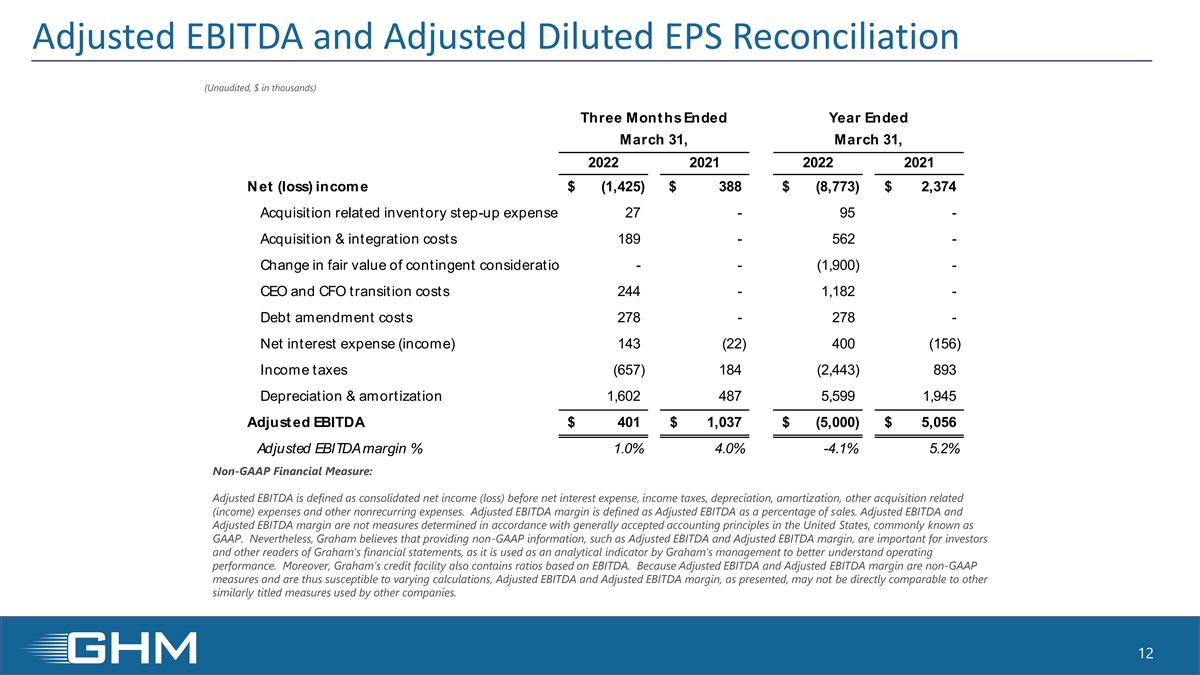
Adjusted EBITDA and Adjusted Diluted EPS Reconciliation (Unaudited, $ in thousands) Three Months Ended Year Ended March 31, March 31, 2022 2021 2022 2021 Net (loss) income $ (1,425) $ 388 $ (8,773) $ 2,374 Acquisition related inventory step-up expense 27 - 95 - Acquisition & integration costs 189 - 562 - Change in fair value of contingent consideration - - (1,900) - CEO and CFO transition costs 244 - 1,182 - Debt amendment costs 278 - 278 - Net interest expense (income) 143 (22) 400 ( 156) Income taxes ( 657) 184 ( 2,443) 893 Depreciation & amortization 1,602 487 5,599 1 ,945 Adjusted EBITDA $ 401 $ 1 ,037 $ (5,000) $ 5 ,056 Adjusted EBITDA margin % 1.0% 4.0% -4.1% 5.2% Non-GAAP Financial Measure: Adjusted EBITDA is defined as consolidated net income (loss) before net interest expense, income taxes, depreciation, amortization, other acquisition related (income) expenses and other nonrecurring expenses. Adjusted EBITDA margin is defined as Adjusted EBITDA as a percentage of sales. Adjusted EBITDA and Adjusted EBITDA margin are not measures determined in accordance with generally accepted accounting principles in the United States, commonly known as GAAP. Nevertheless, Graham believes that providing non-GAAP information, such as Adjusted EBITDA and Adjusted EBITDA margin, are important for investors and other readers of Graham's financial statements, as it is used as an analytical indicator by Graham's management to better understand operating performance. Moreover, Graham’s credit facility also contains ratios based on EBITDA. Because Adjusted EBITDA and Adjusted EBITDA margin are non-GAAP measures and are thus susceptible to varying calculations, Adjusted EBITDA and Adjusted EBITDA margin, as presented, may not be directly comparable to other similarly titled measures used by other companies. 12
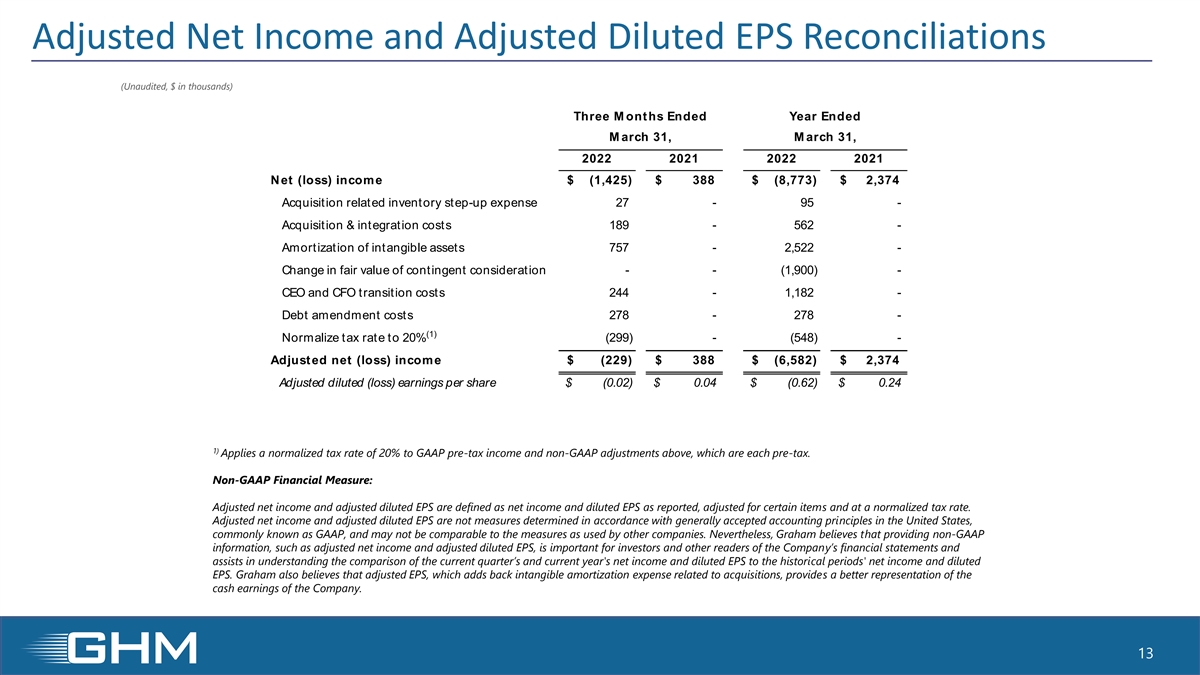
Adjusted Net Income and Adjusted Diluted EPS Reconciliations (Unaudited, $ in thousands) Three M onths Ended Year Ended M arch 31, M arch 31, 2022 2021 2022 2021 Net (loss) income $ (1,425) $ 388 $ (8,773) $ 2 ,374 Acquisition related inventory step-up expense 27 - 95 - Acquisition & integration costs 189 - 562 - Amortization of intangible assets 757 - 2,522 - Change in fair value of contingent consideration - - (1,900) - CEO and CFO transition costs 244 - 1,182 - Debt amendment costs 278 - 278 - (1) Normalize tax rate to 20% (299) - (548) - Adjusted net (loss) income $ (229) $ 388 $ (6,582) $ 2,374 Adjusted diluted (loss) earnings per share $ (0.02) $ 0.04 $ (0.62) $ 0.24 1) Applies a normalized tax rate of 20% to GAAP pre-tax income and non-GAAP adjustments above, which are each pre-tax. Non-GAAP Financial Measure: Adjusted net income and adjusted diluted EPS are defined as net income and diluted EPS as reported, adjusted for certain items and at a normalized tax rate. Adjusted net income and adjusted diluted EPS are not measures determined in accordance with generally accepted accounting principles in the United States, commonly known as GAAP, and may not be comparable to the measures as used by other companies. Nevertheless, Graham believes that providing non-GAAP information, such as adjusted net income and adjusted diluted EPS, is important for investors and other readers of the Company’s financial statements and assists in understanding the comparison of the current quarter’s and current year's net income and diluted EPS to the historical periods' net income and diluted EPS. Graham also believes that adjusted EPS, which adds back intangible amortization expense related to acquisitions, provides a better representation of the cash earnings of the Company. 13