Exhibit 99.2 G r a h a m C o r p o r a t i o n Q4 FY2023 Teleconference June 8, 2023 Daniel J. Thoren, President and Chief Executive Officer Christopher J. Thome, Vice President - Finance and Chief Financial Officer www.GrahamCorp.com
Safe Harbor Statement Safe Harbor Regarding Forward Looking Statements This presentation contains forward-looking statements within the meaning of Section 27A of the Securities Act of 1933, as amended, and Section 21E of the Securities Exchange Act of 1934, as amended. Forward-looking statements are subject to risks, uncertainties and assumptions and are identified by words such as “expects,” “outlook,” “anticipates,” “believes,” “could,” “guidance,” “should,” ”may”, “will,” “goals,” “estimated,” “potential,” “plan” and other similar words. All statements addressing operating performance, events, or developments that Graham Corporation expects or anticipates will occur in the future, including but not limited to, profitability of future projects and the business, its ability to deliver to plan, its ability to meet customers’ shipment and delivery expectations, the future impact of low margin defense projects and related cost overruns, expected expansion and growth opportunities within its domestic and international markets, anticipated sales, revenues, gross margin, adjusted EBITDA, adjusted EBITDA margins, capital expenditures and SG&A expenses, the timing of conversion of backlog to sales, market presence, profit margins, tax rates, its ability to improve cost competitiveness and productivity, customer preferences, changes in market conditions in the industries in which it operates, the effect on its business of volatility in commodities prices, including, but not limited to, changes in general economic conditions and customer behavior, forecasts regarding the timing and scope of the economic recovery in its markets, and its acquisition and growth strategy, are forward-looking statements. Because they are forward-looking, they should be evaluated in light of important risk factors and uncertainties. These risk factors and uncertainties are more fully described in Graham Corporation’s most recent Annual Report on Form 10-K filed with the Securities and Exchange Commission (the “SEC”), included under the heading entitled “Risk Factors”, and in other reports filed with the SEC. Should one or more of these risks or uncertainties materialize or should any of Graham Corporation’s underlying assumptions prove incorrect, actual results may vary materially from those currently anticipated. In addition, undue reliance should not be placed on Graham Corporation’s forward-looking statements. Except as required by law, Graham Corporation disclaims any obligation to update or publicly announce any revisions to any of the forward-looking statements contained in this presentation. Use of Forward-Looking Non-GAAP Financial Measures Forward looking adjusted EBITDA and adjusted EBITDA margin are non-GAAP measures. The Company is unable to present a quantitative reconciliation of these forward-looking non-GAAP financial measures to their most directly comparable forward-looking GAAP financial measures because such information is not available, and management cannot reliably predict the necessary components of such GAAP measures without unreasonable effort largely because forecasting or predicting our future operating results is subject to many factors out of our control or not readily predictable. In addition, the Company believes that such reconciliations would imply a degree of precision that would be confusing or misleading to investors. The unavailable information could have a significant impact on the Company’s fiscal 2023 financial results. These non-GAAP financial measures are preliminary estimates and are subject to risks and uncertainties, including, among others, quarter-end, and year-end adjustments. Any variation between the Company’s actual results and preliminary financial estimates set forth in this presentation may be material. 2
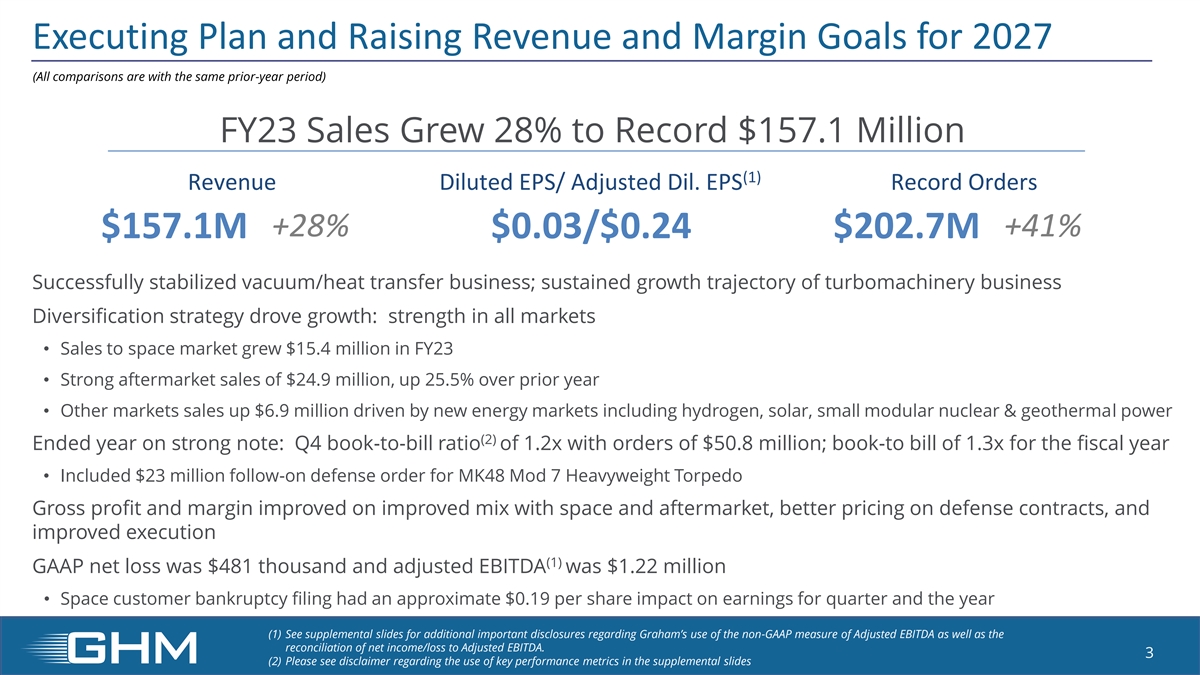
Executing Plan and Raising Revenue and Margin Goals for 2027 (All comparisons are with the same prior-year period) FY23 Sales Grew 28% to Record $157.1 Million (1) Revenue Diluted EPS/ Adjusted Dil. EPS Record Orders +28% +41% $157.1M $0.03/$0.24 $202.7M Successfully stabilized vacuum/heat transfer business; sustained growth trajectory of turbomachinery business Diversification strategy drove growth: strength in all markets • Sales to space market grew $15.4 million in FY23 • Strong aftermarket sales of $24.9 million, up 25.5% over prior year • Other markets sales up $6.9 million driven by new energy markets including hydrogen, solar, small modular nuclear & geothermal power (2) Ended year on strong note: Q4 book-to-bill ratio of 1.2x with orders of $50.8 million; book-to bill of 1.3x for the fiscal year • Included $23 million follow-on defense order for MK48 Mod 7 Heavyweight Torpedo Gross profit and margin improved on improved mix with space and aftermarket, better pricing on defense contracts, and improved execution (1) GAAP net loss was $481 thousand and adjusted EBITDA was $1.22 million • Space customer bankruptcy filing had an approximate $0.19 per share impact on earnings for quarter and the year (1) See supplemental slides for additional important disclosures regarding Graham’s use of the non-GAAP measure of Adjusted EBITDA as well as the reconciliation of net income/loss to Adjusted EBITDA. 3 (2) Please see disclaimer regarding the use of key performance metrics in the supplemental slides
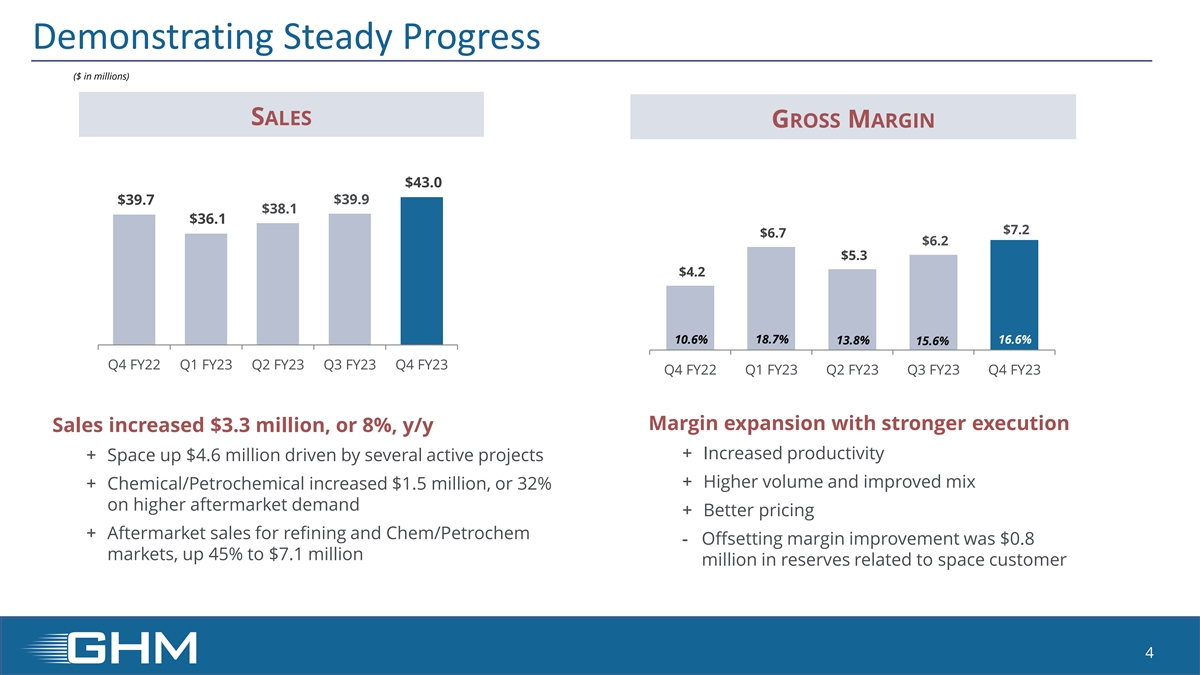
Demonstrating Steady Progress ($ in millions) SALES GROSS MARGIN $43.0 $39.7 $39.9 $38.1 $36.1 $7.2 $6.7 $6.2 $5.3 $4.2 10.6% 18.7% 16.6% 13.8% 15.6% Q4 FY22 Q1 FY23 Q2 FY23 Q3 FY23 Q4 FY23 Q4 FY22 Q1 FY23 Q2 FY23 Q3 FY23 Q4 FY23 Margin expansion with stronger execution Sales increased $3.3 million, or 8%, y/y + Increased productivity + Space up $4.6 million driven by several active projects + Higher volume and improved mix + Chemical/Petrochemical increased $1.5 million, or 32% on higher aftermarket demand + Better pricing + Aftermarket sales for refining and Chem/Petrochem - Offsetting margin improvement was $0.8 markets, up 45% to $7.1 million million in reserves related to space customer 4
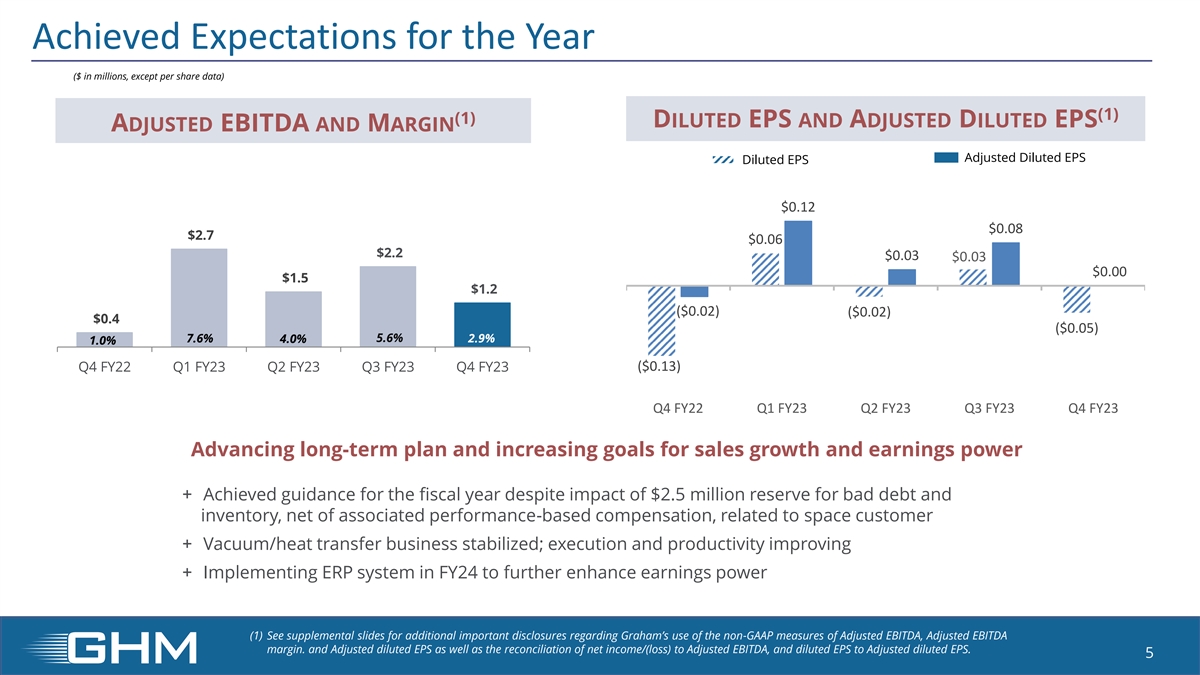
Achieved Expectations for the Year ($ in millions, except per share data) (1) (1) DILUTED EPS AND ADJUSTED DILUTED EPS ADJUSTED EBITDA AND MARGIN Adjusted Diluted EPS Diluted EPS $0.12 $0.08 $2.7 $0.06 $2.2 $0.03 $0.03 $0.00 $1.5 $1.2 6.7% ($0.02) ($0.02) $0.4 ($0.05) 7.6% 5.6% 2.9% 4.0% 1.0% Q4 FY22 Q1 FY23 Q2 FY23 Q3 FY23 Q4 FY23 ($0.13) Q4 FY22 Q1 FY23 Q2 FY23 Q3 FY23 Q4 FY23 Advancing long-term plan and increasing goals for sales growth and earnings power + Achieved guidance for the fiscal year despite impact of $2.5 million reserve for bad debt and 15.6% inventory, net of associated performance-based compensation, related to space customer + Vacuum/heat transfer business stabilized; execution and productivity improving + Implementing ERP system in FY24 to further enhance earnings power (1) See supplemental slides for additional important disclosures regarding Graham’s use of the non-GAAP measures of Adjusted EBITDA, Adjusted EBITDA margin. and Adjusted diluted EPS as well as the reconciliation of net income/(loss) to Adjusted EBITDA, and diluted EPS to Adjusted diluted EPS. 5
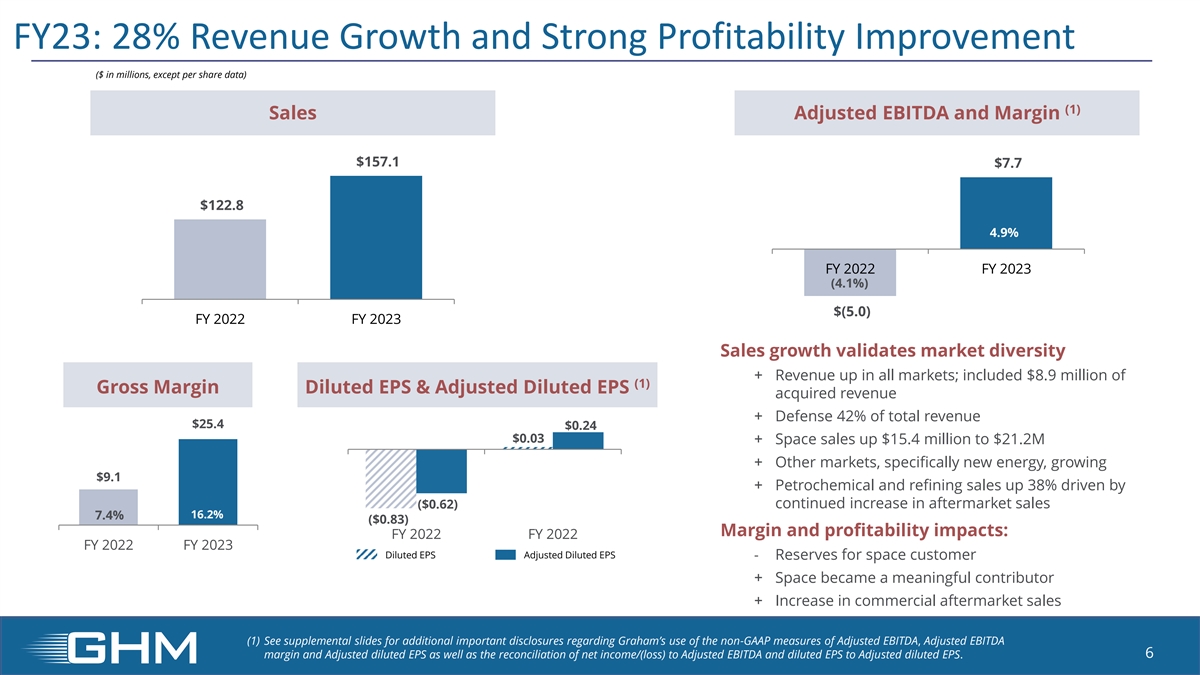
FY23: 28% Revenue Growth and Strong Profitability Improvement ($ in millions, except per share data) (1) Sales Adjusted EBITDA and Margin $157.1 $7.7 $122.8 4.9% FY 2022 FY 2023 (4.1%) $(5.0) FY 2022 FY 2023 Sales growth validates market diversity + Revenue up in all markets; included $8.9 million of (1) Gross Margin Diluted EPS & Adjusted Diluted EPS acquired revenue + Defense 42% of total revenue $25.4 $0.24 $0.03 + Space sales up $15.4 million to $21.2M + Other markets, specifically new energy, growing $9.1 + Petrochemical and refining sales up 38% driven by ($0.62) continued increase in aftermarket sales 16.2% 7.4% ($0.83) Margin and profitability impacts: FY 2022 FY 2022 FY 2022 FY 2023 Diluted EPS Adjusted Diluted EPS - Reserves for space customer + Space became a meaningful contributor + Increase in commercial aftermarket sales (1) See supplemental slides for additional important disclosures regarding Graham’s use of the non-GAAP measures of Adjusted EBITDA, Adjusted EBITDA margin and Adjusted diluted EPS as well as the reconciliation of net income/(loss) to Adjusted EBITDA and diluted EPS to Adjusted diluted EPS. 6
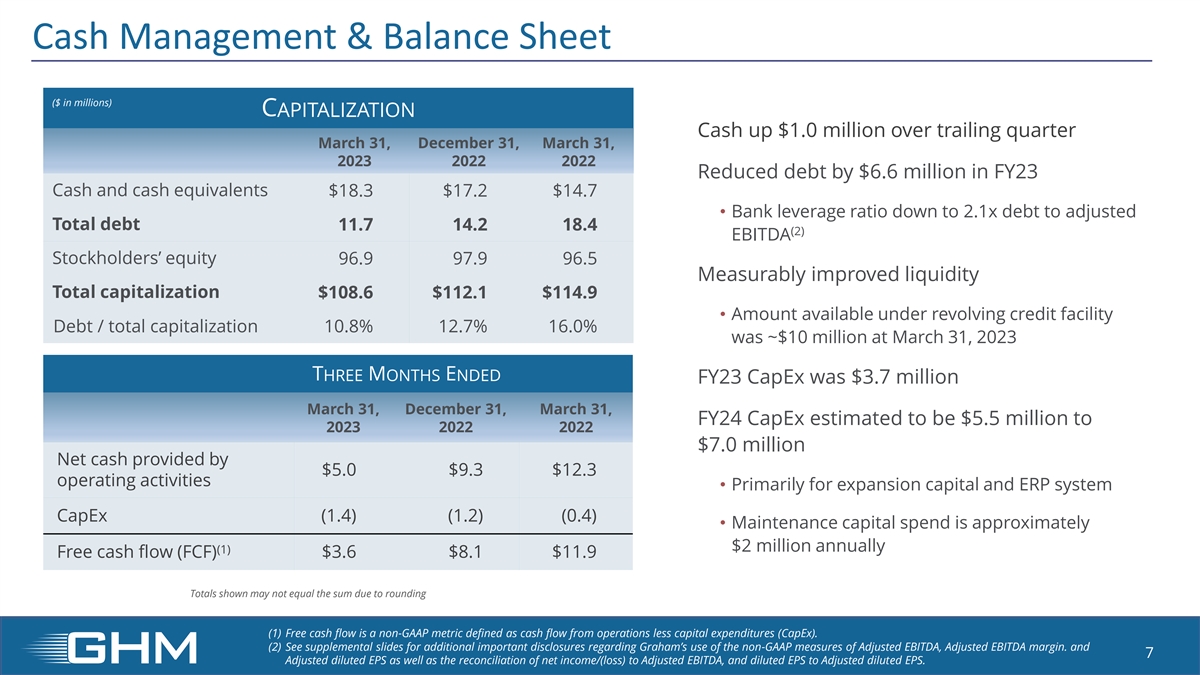
Cash Management & Balance Sheet ($ in millions) C APITALIZATION Cash up $1.0 million over trailing quarter March 31, December 31, March 31, 2023 2022 2022 Reduced debt by $6.6 million in FY23 Cash and cash equivalents $18.3 $17.2 $14.7 • Bank leverage ratio down to 2.1x debt to adjusted Total debt 11.7 14.2 18.4 (2) EBITDA Stockholders’ equity 96.9 97.9 96.5 Measurably improved liquidity Total capitalization $108.6 $112.1 $114.9 • Amount available under revolving credit facility Debt / total capitalization 10.8% 12.7% 16.0% was ~$10 million at March 31, 2023 THREE MONTHS ENDED FY23 CapEx was $3.7 million March 31, December 31, March 31, FY24 CapEx estimated to be $5.5 million to 2023 2022 2022 $7.0 million Net cash provided by $5.0 $9.3 $12.3 operating activities • Primarily for expansion capital and ERP system CapEx (1.4) (1.2) (0.4) • Maintenance capital spend is approximately $2 million annually (1) Free cash flow (FCF) $3.6 $8.1 $11.9 Totals shown may not equal the sum due to rounding (1) Free cash flow is a non-GAAP metric defined as cash flow from operations less capital expenditures (CapEx). (2) See supplemental slides for additional important disclosures regarding Graham’s use of the non-GAAP measures of Adjusted EBITDA, Adjusted EBITDA margin. and 7 Adjusted diluted EPS as well as the reconciliation of net income/(loss) to Adjusted EBITDA, and diluted EPS to Adjusted diluted EPS.
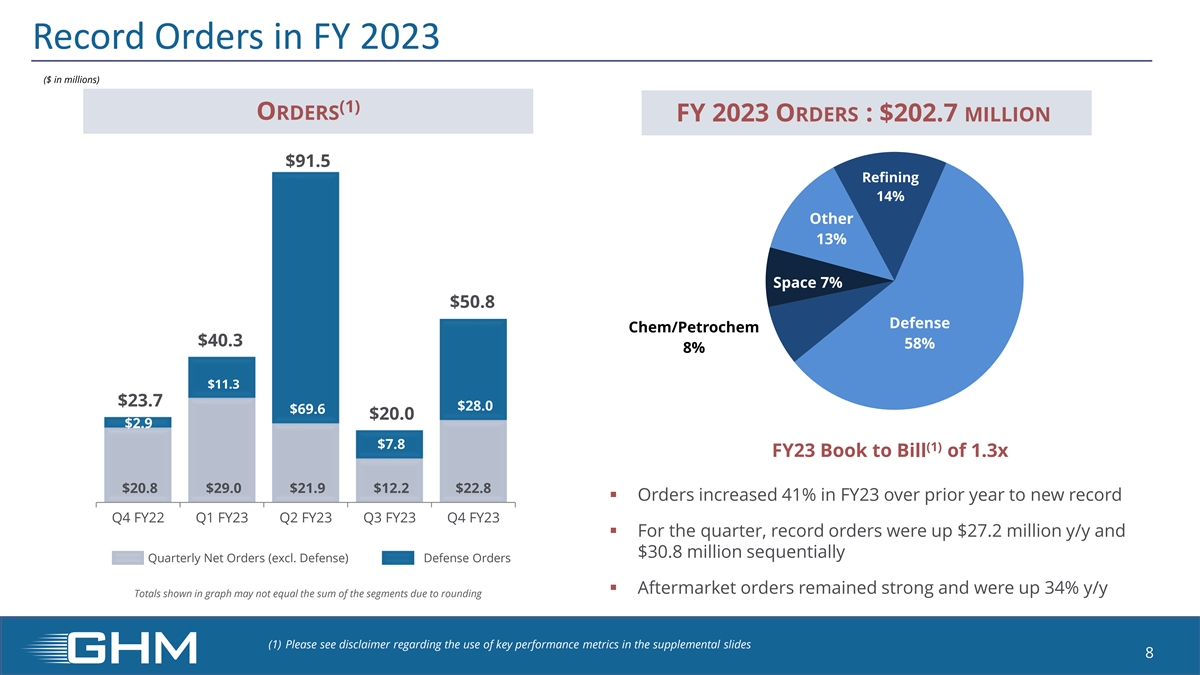
Record Orders in FY 2023 ($ in millions) (1) ORDERS FY 2023 ORDERS : $202.7 MILLION $91.5 Refining 14% Other 13% Space 7% $50.8 Defense Chem/Petrochem $40.3 58% 8% $11.3 $23.7 $28.0 $69.6 $20.0 $2.9 $7.8 (1) FY23 Book to Bill of 1.3x $20.8 $29.0 $21.9 $12.2 $22.8 ▪ Orders increased 41% in FY23 over prior year to new record Q4 FY22 Q1 FY23 Q2 FY23 Q3 FY23 Q4 FY23 ▪ For the quarter, record orders were up $27.2 million y/y and $30.8 million sequentially Quarterly Net Orders (excl. Defense) Defense Orders ▪ Aftermarket orders remained strong and were up 34% y/y Totals shown in graph may not equal the sum of the segments due to rounding (1) Please see disclaimer regarding the use of key performance metrics in the supplemental slides 8
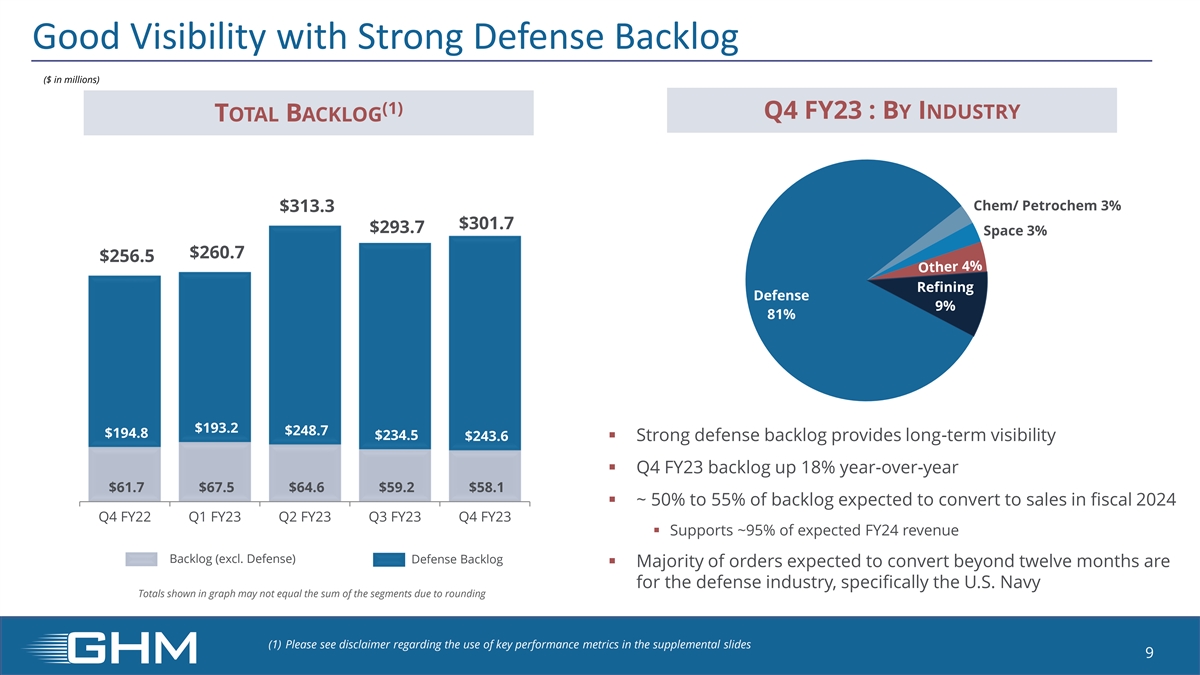
Good Visibility with Strong Defense Backlog ($ in millions) (1) Q4 FY23 : BY INDUSTRY TOTAL BACKLOG Chem/ Petrochem 3% $313.3 $301.7 $293.7 Space 3% $260.7 $256.5 Refining Defense 9% 81% $193.2 $248.7 $194.8 $234.5 $243.6 ▪ Strong defense backlog provides long-term visibility ▪ Q4 FY23 backlog up 18% year-over-year $61.7 $67.5 $64.6 $59.2 $58.1 ▪ ~ 50% to 55% of backlog expected to convert to sales in fiscal 2024 Q4 FY22 Q1 FY23 Q2 FY23 Q3 FY23 Q4 FY23 ▪ Supports ~95% of expected FY24 revenue Backlog (excl. Defense) Defense Backlog ▪ Majority of orders expected to convert beyond twelve months are for the defense industry, specifically the U.S. Navy Totals shown in graph may not equal the sum of the segments due to rounding (1) Please see disclaimer regarding the use of key performance metrics in the supplemental slides 9
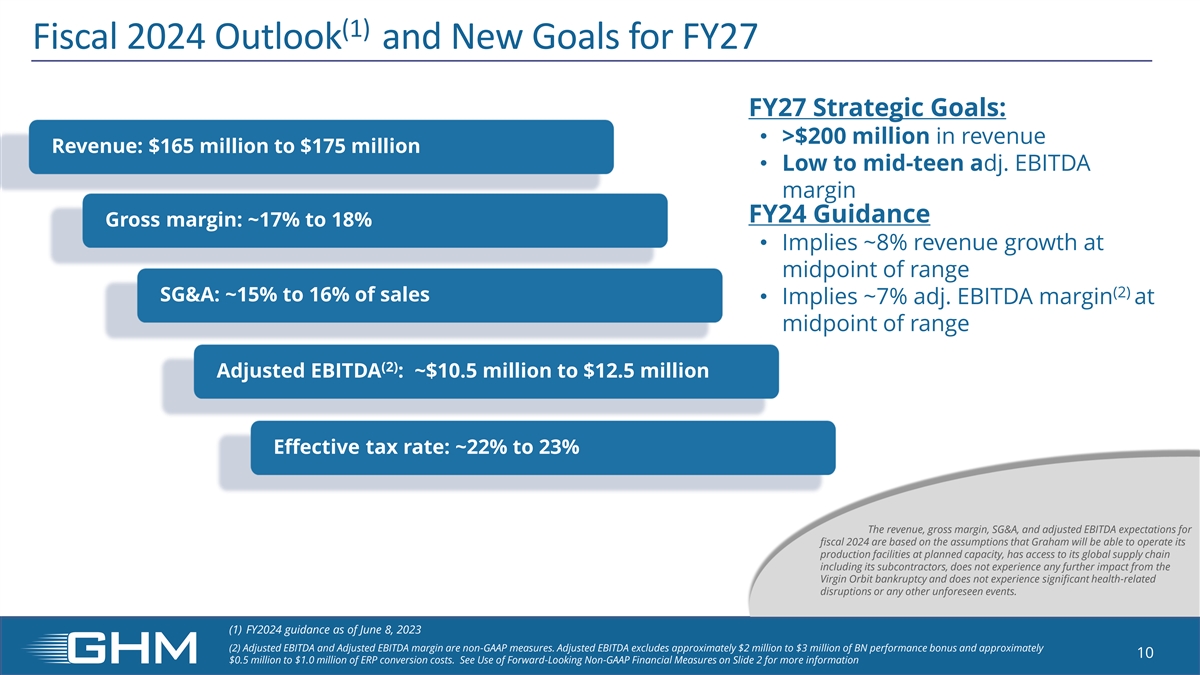
(1) Fiscal 2024 Outlook and New Goals for FY27 FY27 Strategic Goals: • >$200 million in revenue Revenue: $165 million to $175 million • Low to mid-teen adj. EBITDA margin FY24 Guidance Gross margin: ~17% to 18% • Implies ~8% revenue growth at midpoint of range (2) SG&A: ~15% to 16% of sales • Implies ~7% adj. EBITDA margin at midpoint of range (2) Adjusted EBITDA : ~$10.5 million to $12.5 million Effective tax rate: ~22% to 23% The revenue, gross margin, SG&A, and adjusted EBITDA expectations for fiscal 2024 are based on the assumptions that Graham will be able to operate its production facilities at planned capacity, has access to its global supply chain including its subcontractors, does not experience any further impact from the Virgin Orbit bankruptcy and does not experience significant health-related disruptions or any other unforeseen events. (1) FY2024 guidance as of June 8, 2023 (2) Adjusted EBITDA and Adjusted EBITDA margin are non-GAAP measures. Adjusted EBITDA excludes approximately $2 million to $3 million of BN performance bonus and approximately 10 $0.5 million to $1.0 million of ERP conversion costs. See Use of Forward-Looking Non-GAAP Financial Measures on Slide 2 for more information
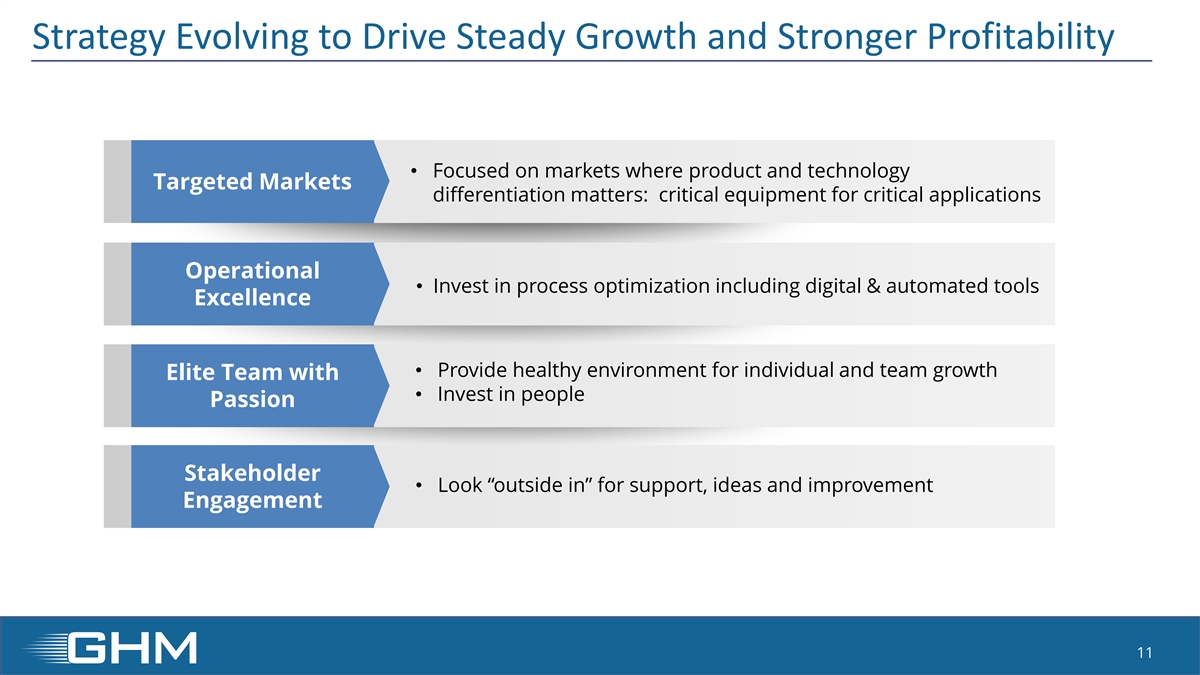
Strategy Evolving to Drive Steady Growth and Stronger Profitability • Focused on markets where product and technology Targeted Markets differentiation matters: critical equipment for critical applications Operational • Invest in process optimization including digital & automated tools Excellence • Provide healthy environment for individual and team growth Elite Team with • Invest in people Passion Stakeholder • Look “outside in” for support, ideas and improvement Engagement 11
SUPPLEMENTAL INFORMATION
Disclaimer Regarding Key Performance Metrics Key Performance Indicators In addition to the foregoing non-GAAP measures, management uses the following key performance metrics to analyze and measure the Company’s financial performance and results of operations: orders, backlog, and book-to-bill ratio. Management uses orders and backlog as measures of current and future business and financial performance, and these may not be comparable with measures provided by other companies. Orders represent written communications received from customers requesting the Company to provide products and/or services. Backlog is defined as the total dollar value of net orders received for which revenue has not yet been recognized. Management believes tracking orders and backlog are useful as it often times is a leading indicator of future performance. In accordance with industry practice, contracts may include provisions for cancellation, termination, or suspension at the discretion of the customer. The book-to-bill ratio is an operational measure that management uses to track the growth prospects of the Company. The Company calculates the book-to-bill ratio for a given period as net orders divided by net sales. Given that each of orders, backlog and book-to-bill ratio is an operational measure and that the Company's methodology for calculating orders, backlog and book-to-bill ratio does not meet the definition of a non-GAAP measure, as that term is defined by the U.S. Securities and Exchange Commission, a quantitative reconciliation for each is not required or provided. Company Confidential 13
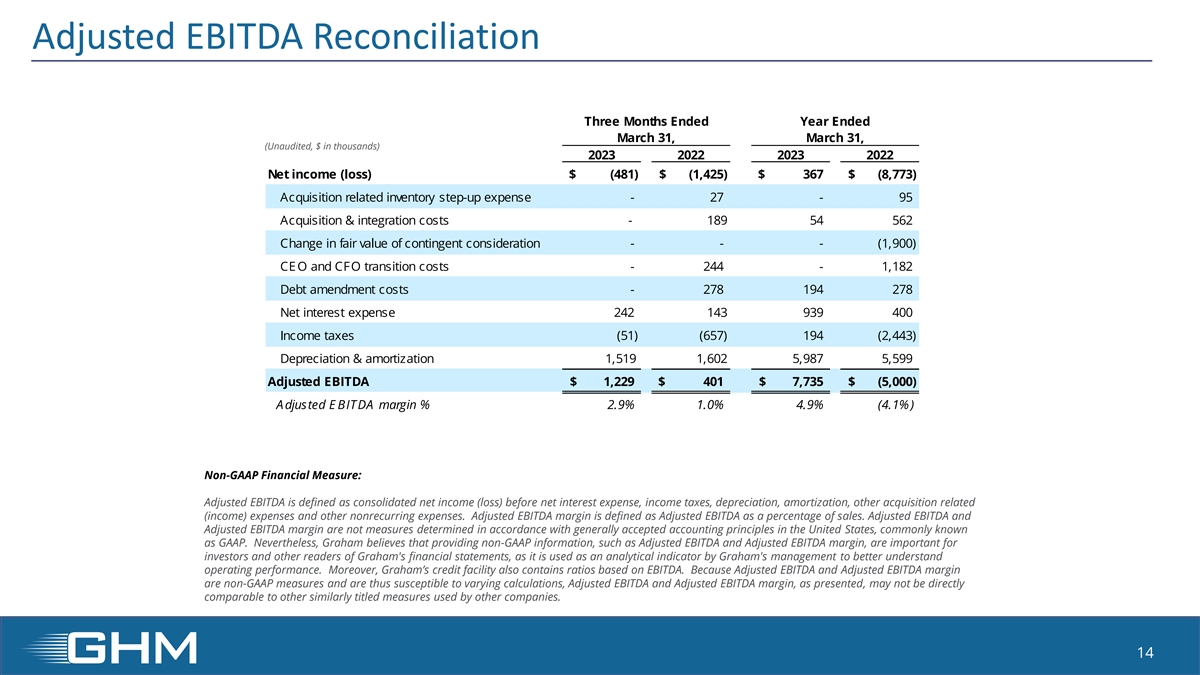
Adjusted EBITDA Reconciliation Three Months Ended Year Ended March 31, March 31, (Unaudited, $ in thousands) 2023 2022 2023 2022 Net income (loss) $ ( 481) $ (1,425) $ 367 $ ( 8,773) Acquisition related inventory step-up expense - 27 - 95 Acquisition & integration costs - 189 54 562 Change in fair value of contingent consideration - - - ( 1,900) CE O and CFO transition costs - 244 - 1,182 Debt amendment costs - 278 194 278 Net interest expense 242 143 939 400 Income taxes ( 51) (657) 194 (2,443) Depreciation & amortization 1,519 1,602 5 ,987 5,599 Adjusted EBITDA $ 1 ,229 $ 401 $ 7 ,735 $ (5,000) A djusted E BITDA margin % 2.9% 1.0% 4.9% (4.1%) Non-GAAP Financial Measure: Adjusted EBITDA is defined as consolidated net income (loss) before net interest expense, income taxes, depreciation, amortization, other acquisition related (income) expenses and other nonrecurring expenses. Adjusted EBITDA margin is defined as Adjusted EBITDA as a percentage of sales. Adjusted EBITDA and Adjusted EBITDA margin are not measures determined in accordance with generally accepted accounting principles in the United States, commonly known as GAAP. Nevertheless, Graham believes that providing non-GAAP information, such as Adjusted EBITDA and Adjusted EBITDA margin, are important for investors and other readers of Graham's financial statements, as it is used as an analytical indicator by Graham's management to better understand operating performance. Moreover, Graham’s credit facility also contains ratios based on EBITDA. Because Adjusted EBITDA and Adjusted EBITDA margin are non-GAAP measures and are thus susceptible to varying calculations, Adjusted EBITDA and Adjusted EBITDA margin, as presented, may not be directly comparable to other similarly titled measures used by other companies. 14
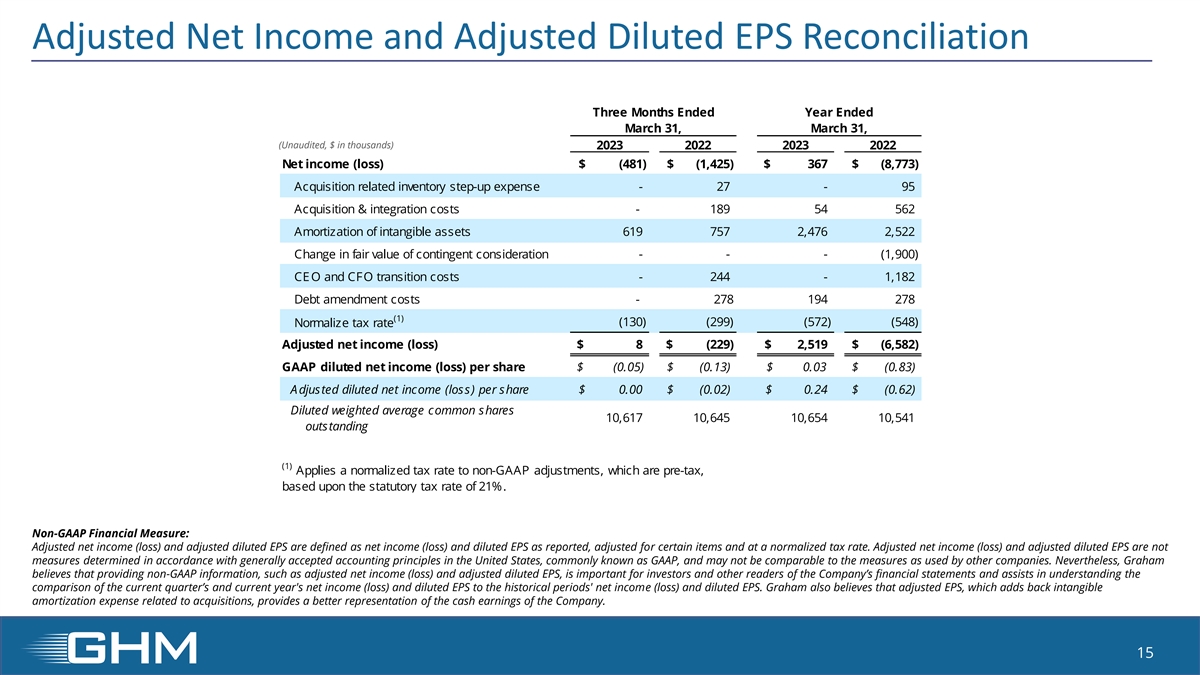
Adjusted Net Income and Adjusted Diluted EPS Reconciliation Three Months Ended Year Ended March 31, March 31, (Unaudited, $ in thousands) 2023 2022 2023 2022 Net income (loss) $ ( 481) $ (1,425) $ 367 $ (8,773) Acquisition related inventory step-up expense - 27 - 95 Acquisition & integration costs - 189 54 562 Amortization of intangible assets 619 757 2,476 2 ,522 Change in fair value of contingent consideration - - - ( 1,900) CE O and CFO transition costs - 244 - 1 ,182 Debt amendment costs - 278 194 278 (1) ( 130) ( 299) ( 572) (548) Normalize tax rate Adjusted net income (loss) $ 8 $ ( 229) $ 2 ,519 $ (6,582) GAAP diluted net income (loss) per share $ (0.05) $ (0.13) $ 0.03 $ (0.83) A djusted diluted net income (loss) per share $ 0.00 $ (0.02) $ 0.24 $ (0.62) Diluted weighted average common shares 1 0,617 10,645 10,654 1 0,541 outstanding (1) Applies a normalized tax rate to non-GAAP adjustments, which are pre-tax, based upon the statutory tax rate of 21%. Non-GAAP Financial Measure: Adjusted net income (loss) and adjusted diluted EPS are defined as net income (loss) and diluted EPS as reported, adjusted for certain items and at a normalized tax rate. Adjusted net income (loss) and adjusted diluted EPS are not measures determined in accordance with generally accepted accounting principles in the United States, commonly known as GAAP, and may not be comparable to the measures as used by other companies. Nevertheless, Graham believes that providing non-GAAP information, such as adjusted net income (loss) and adjusted diluted EPS, is important for investors and other readers of the Company’s financial statements and assists in understanding the comparison of the current quarter’s and current year's net income (loss) and diluted EPS to the historical periods' net income (loss) and diluted EPS. Graham also believes that adjusted EPS, which adds back intangible amortization expense related to acquisitions, provides a better representation of the cash earnings of the Company. 15
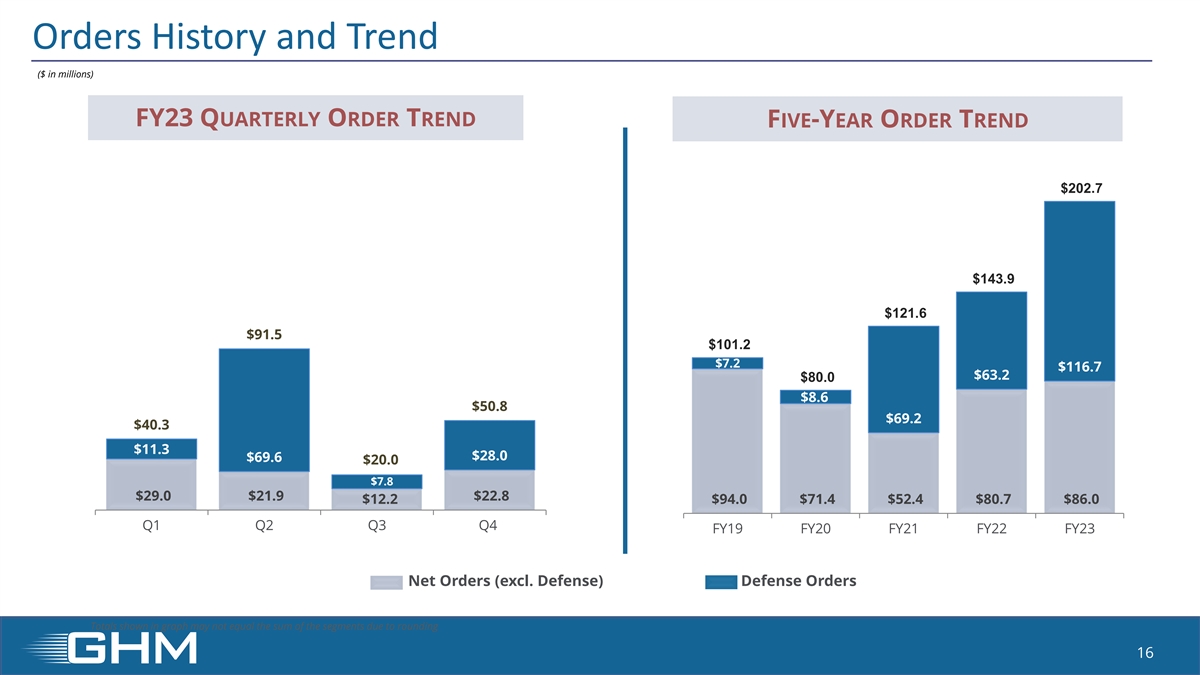
Orders History and Trend ($ in millions) FY23 QUARTERLY ORDER TREND FIVE-YEAR ORDER TREND $202.7 $143.9 $121.6 $91.5 $101.2 $7.2 $116.7 $63.2 $80.0 $8.6 $50.8 $69.2 $40.3 $11.3 $28.0 $69.6 $20.0 $7.8 $29.0 $21.9 $22.8 $12.2 $94.0 $71.4 $52.4 $80.7 $86.0 Q1 Q2 Q3 Q4 FY19 FY20 FY21 FY22 FY23 Net Orders (excl. Defense) Defense Orders Totals shown in graph may not equal the sum of the segments due to rounding 16
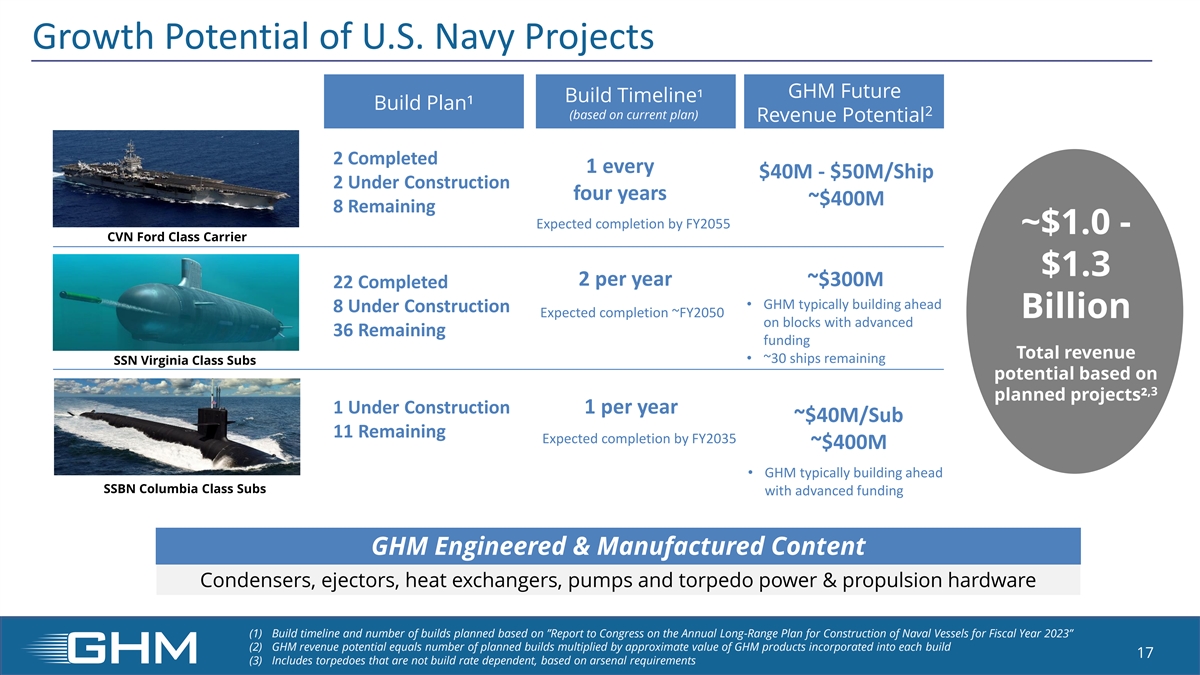
Growth Potential of U.S. Navy Projects GHM Future Build Timeline¹ Build Plan¹ 2 (based on current plan) Revenue Potential 2 Completed 1 every $40M - $50M/Ship 2 Under Construction four years ~$400M 8 Remaining Expected completion by FY2055 ~$1.0 - CVN Ford Class Carrier $1.3 2 per year ~$300M 22 Completed • GHM typically building ahead 8 Under Construction Expected completion ~FY2050 Billion on blocks with advanced 36 Remaining funding Total revenue • ~30 ships remaining SSN Virginia Class Subs potential based on ,3 planned projects² 1 Under Construction 1 per year ~$40M/Sub 11 Remaining Expected completion by FY2035 ~$400M • GHM typically building ahead SSBN Columbia Class Subs with advanced funding GHM Engineered & Manufactured Content Condensers, ejectors, heat exchangers, pumps and torpedo power & propulsion hardware (1) Build timeline and number of builds planned based on ”Report to Congress on the Annual Long-Range Plan for Construction of Naval Vessels for Fiscal Year 2023” (2) GHM revenue potential equals number of planned builds multiplied by approximate value of GHM products incorporated into each build 17 (3) Includes torpedoes that are not build rate dependent, based on arsenal requirements