
Exhibit 99.3 Fourth Quarter & Full-Year Fiscal 2025 Financial Results JUNE 9, 2025 GRAHAM CORPORATION © 2025 GRAHAM CORPORATION, ALL RIGHTS RESERVED 1
Safe Harbor Statement Safe Harbor Regarding Forward Looking Statements This presentation contains forward-looking statements within the meaning of Section 27A of the Securities Act of 1933, as amended, and Section 21E of the Securities Exchange Act of 1934, as amended. Forward-looking statements are subject to risks, uncertainties and assumptions and are identified by words such as “expects,” “future,” “outlook,” “anticipates,” “believes,” “could,” “guidance,” “should,” “target,” ”may”, “will,” “plan” and other similar words. All statements addressing operating performance, events, or developments that Graham Corporation expects or anticipates will occur in the future, including but not limited to, profitability of future projects and the business, its ability to deliver to plan, its ability to continue to strengthen relationships with customers in the defense industry, its ability to secure future projects and applications, expected expansion and growth opportunities, anticipated sales, revenues, adjusted EBITDA, adjusted EBITDA margins, capital expenditures and SG&A expenses, the timing of conversion of backlog to sales, orders, market presence, profit margins, tax rates, tariffs, foreign sales operations, customer preferences, changes in market conditions in the industries in which it operates, changes in general economic conditions and customer behavior, forecasts regarding the timing and scope of the economic recovery in its markets, and its acquisition and growth strategy, are forward-looking statements. Because they are forward-looking, they should be evaluated in light of important risk factors and uncertainties. These risk factors and uncertainties are more fully described in Graham Corporation’s most recent Annual Report filed with the Securities and Exchange Commission (the “SEC”), included under the heading entitled “Risk Factors”, and in other reports filed with the SEC. Should one or more of these risks or uncertainties materialize or should any of Graham Corporation’s underlying assumptions prove incorrect, actual results may vary materially from those currently anticipated. In addition, undue reliance should not be placed on Graham Corporation’s forward-looking statements. Except as required by law, Graham Corporation disclaims any obligation to update or publicly announce any revisions to any of the forward-looking statements contained in this presentation. Use of Key Performance Indicators This presentation includes key performance indicators, such as orders, backlog, and book-to-bill ratio. See the slide entitled Disclaimer Regarding Key Performance Metrics in this presentation for information regarding these key performance indicators. Use of Non-GAAP Measures This presentation includes non-GAAP measures, such as Adjusted EBITDA, Adjusted EBITDA margin, Adjusted Net income (loss) and Adjusted Net income (loss) per diluted share. See the Appendix for information regarding these non-GAAP measures, including reconciliations to the most directly comparable U.S. GAAP financial measures. Use of Forward-Looking Non-GAAP Financial Measures Forward-looking ROIC, adjusted EBITDA and adjusted EBITDA margin are non-GAAP measures. The Company is unable to present a quantitative reconciliation of these forward-looking non-GAAP financial measures to their most directly comparable forward-looking GAAP financial measures because such information is not available, and management cannot reliably predict the necessary components of such GAAP measures without unreasonable effort largely because forecasting or predicting our future operating results is subject to many factors out of our control or not readily predictable. In addition, the Company believes that such reconciliations would imply a degree of precision that would be confusing or misleading to investors. The unavailable information could have a significant impact on the Company’s fiscal 2025 financial results. These non-GAAP financial measures are preliminary estimates and are subject to risks and uncertainties, including, among others, changes in connection with purchase accounting, quarter-end, and year- end adjustments. Any variation between the Company’s actual results and preliminary financial estimates set forth above may be material. Forward-looking ROIC is defined as a return on invested capital and is calculated by dividing net operating profit after taxes by the total invested capital. Forward-looking ROIC is not a measure determined in accordance with GAAP. Nevertheless, Graham believes that providing forward-looking ROIC is important for investors and other readers of Graham’s financial statements, as it is used as an analytical indicator by Graham’s management to better understand profitability and efficiency of use of capital for certain projects. Because forward-looking ROIC is a non-GAAP measure and is thus susceptible to varying calculations, forward-looking ROIC, as presented, may not be directly comparable to other similarly titled measures used by other companies. 2
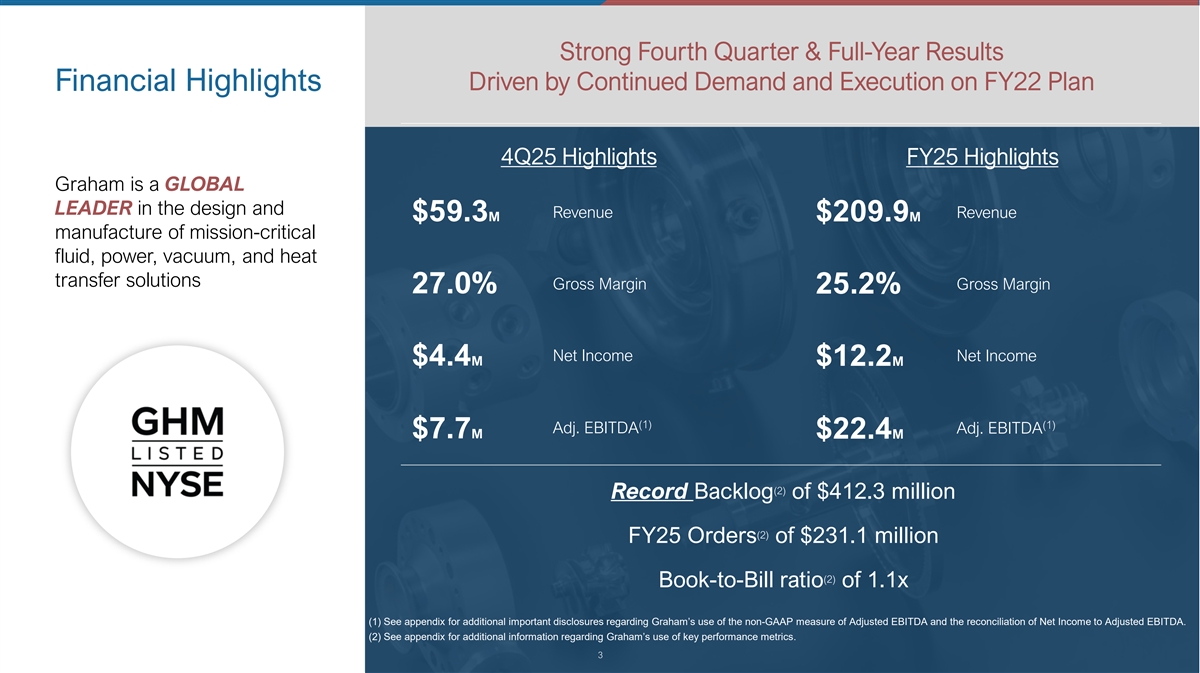
Strong Fourth Quarter & Full-Year Results Driven by Continued Demand and Execution on FY22 Plan Financial Highlights 4Q25 Highlights FY25 Highlights Graham is a GLOBAL LEADER in the design and Revenue Revenue $59.3M $209.9M manufacture of mission-critical fluid, power, vacuum, and heat transfer solutions Gross Margin Gross Margin 27.0% 25.2% Net Income Net Income $4.4M $12.2M (1) (1) Adj. EBITDA Adj. EBITDA $7.7M $22.4M (2) Record Backlog of $412.3 million (2) FY25 Orders of $231.1 million (2) Book-to-Bill ratio of 1.1x (1) See appendix for additional important disclosures regarding Graham’s use of the non-GAAP measure of Adjusted EBITDA and the reconciliation of Net Income to Adjusted EBITDA. (2) See appendix for additional information regarding Graham’s use of key performance metrics. 3

Growth Enablement 4 4 Image credit: Blue Origin
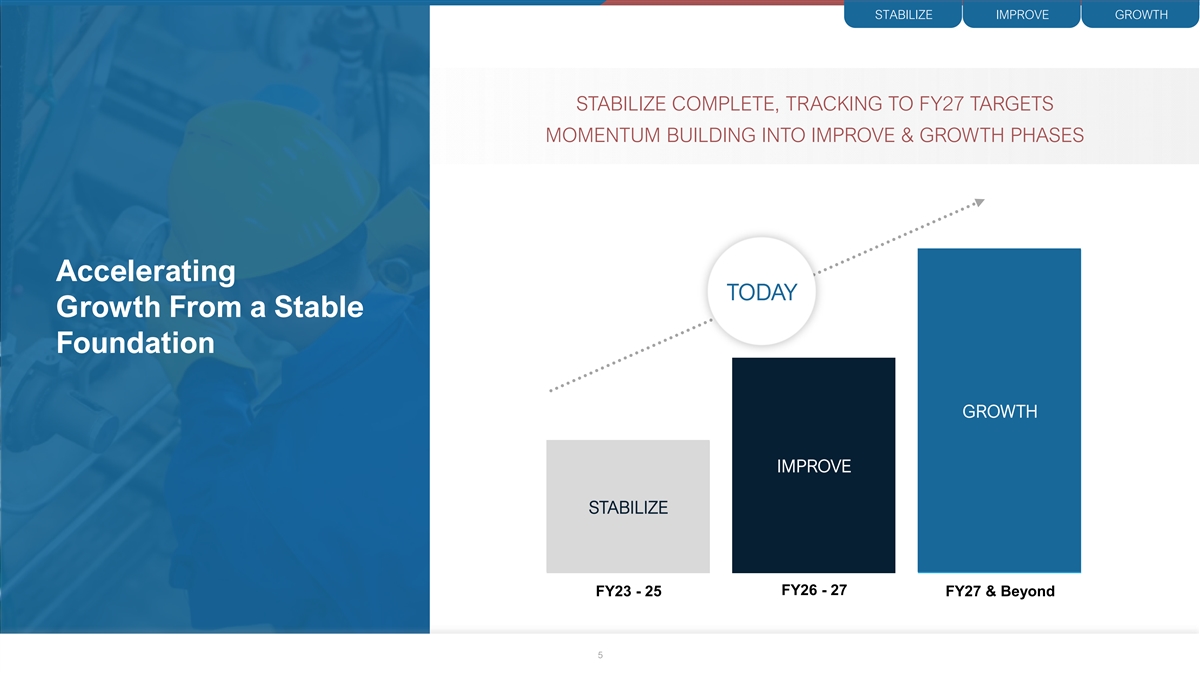
STABILIZE IMPROVE GROWTH STABILIZE COMPLETE, TRACKING TO FY27 TARGETS MOMENTUM BUILDING INTO IMPROVE & GROWTH PHASES Accelerating TODAY Growth From a Stable Foundation GROWTH Growth IMPROVE Improve STABILIZE Stabilize FY26 - 27 FY23 - 25 FY27 & Beyond 5
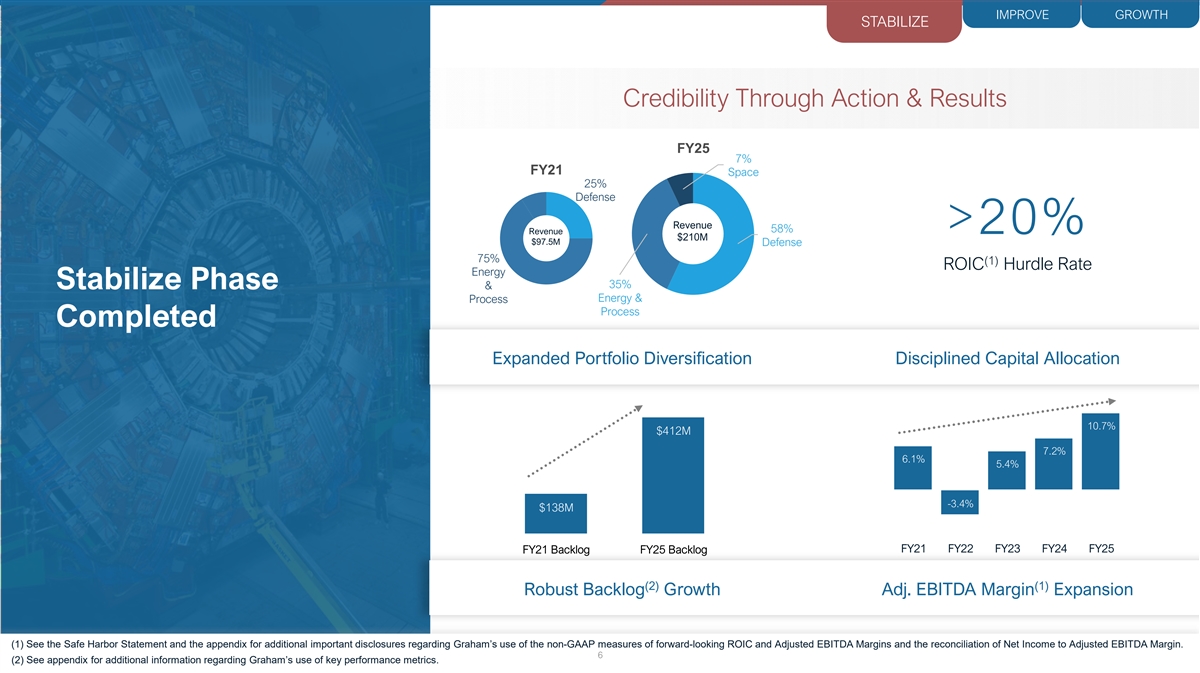
IMPROVE GROWTH STABILIZE Credibility Through Action & Results FY25 7% FY21 Space 25% Defense Revenue 58% Revenue >20% $210M $97.5M Defense 75% (1) ROIC Hurdle Rate Energy 35% Stabilize Phase & Energy & Process Process Completed Expanded Portfolio Diversification Disciplined Capital Allocation 10.7% $412M 10.7% 7.2% 6.1% 5.4% -3.4% $138M 15.2% FY21 Backlog FY25 Backlog FY21 FY22 FY23 FY24 FY25 (2) (1) Robust Backlog Growth Adj. EBITDA Margin Expansion (1) See the Safe Harbor Statement and the appendix for additional important disclosures regarding Graham’s use of the non-GAAP measures of forward-looking ROIC and Adjusted EBITDA Margins and the reconciliation of Net Income to Adjusted EBITDA Margin. 6 (2) See appendix for additional information regarding Graham’s use of key performance metrics.
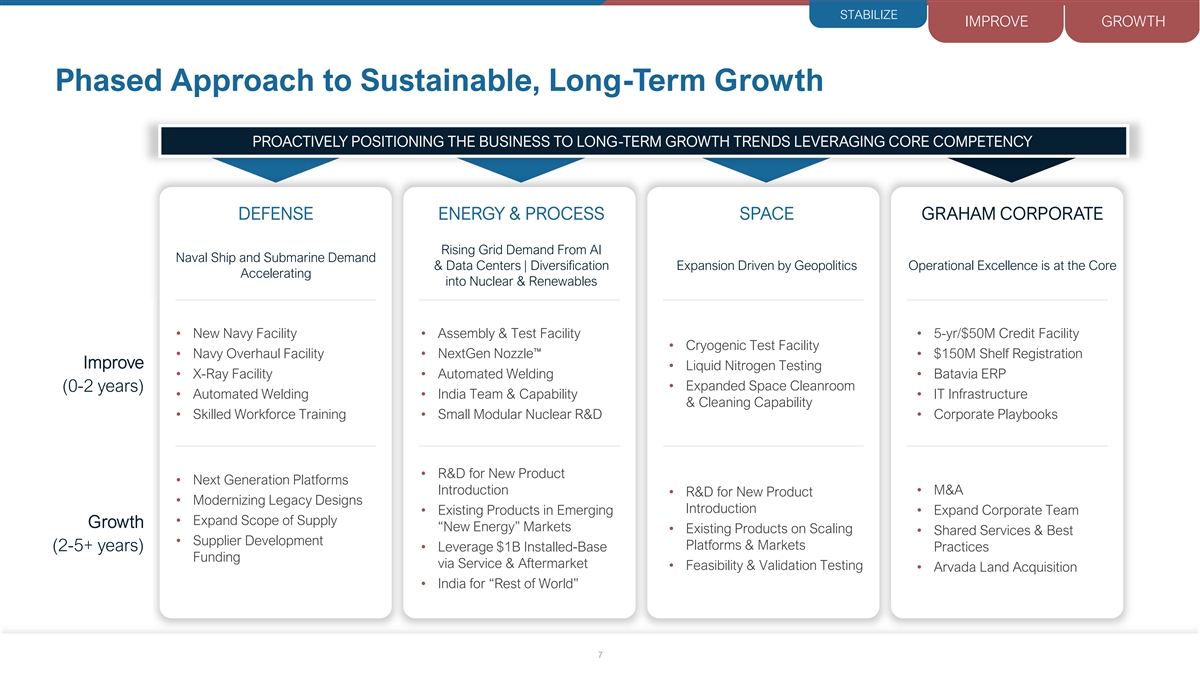
STABILIZE IMPROVE GROWTH Phased Approach to Sustainable, Long-Term Growth PROACTIVELY POSITIONING THE BUSINESS TO LONG-TERM GROWTH TRENDS LEVERAGING CORE COMPETENCY DEFENSE ENERGY & PROCESS SPACE GRAHAM CORPORATE Rising Grid Demand From AI Naval Ship and Submarine Demand & Data Centers | Diversification Expansion Driven by Geopolitics Operational Excellence is at the Core Accelerating into Nuclear & Renewables • New Navy Facility • Assembly & Test Facility • 5-yr/$50M Credit Facility • Cryogenic Test Facility • Navy Overhaul Facility • NextGen Nozzle™ • $150M Shelf Registration Improve • Liquid Nitrogen Testing • X-Ray Facility • Automated Welding • Batavia ERP • Expanded Space Cleanroom (0-2 years) • Automated Welding • India Team & Capability • IT Infrastructure & Cleaning Capability • Skilled Workforce Training • Small Modular Nuclear R&D • Corporate Playbooks • R&D for New Product • Next Generation Platforms Introduction • M&A • R&D for New Product • Modernizing Legacy Designs Introduction • Existing Products in Emerging • Expand Corporate Team • Expand Scope of Supply Growth “New Energy” Markets • Existing Products on Scaling • Shared Services & Best • Supplier Development Platforms & Markets (2-5+ years) • Leverage $1B Installed-Base Practices Funding via Service & Aftermarket • Feasibility & Validation Testing • Arvada Land Acquisition • India for “Rest of World” 7

Financials 8 8
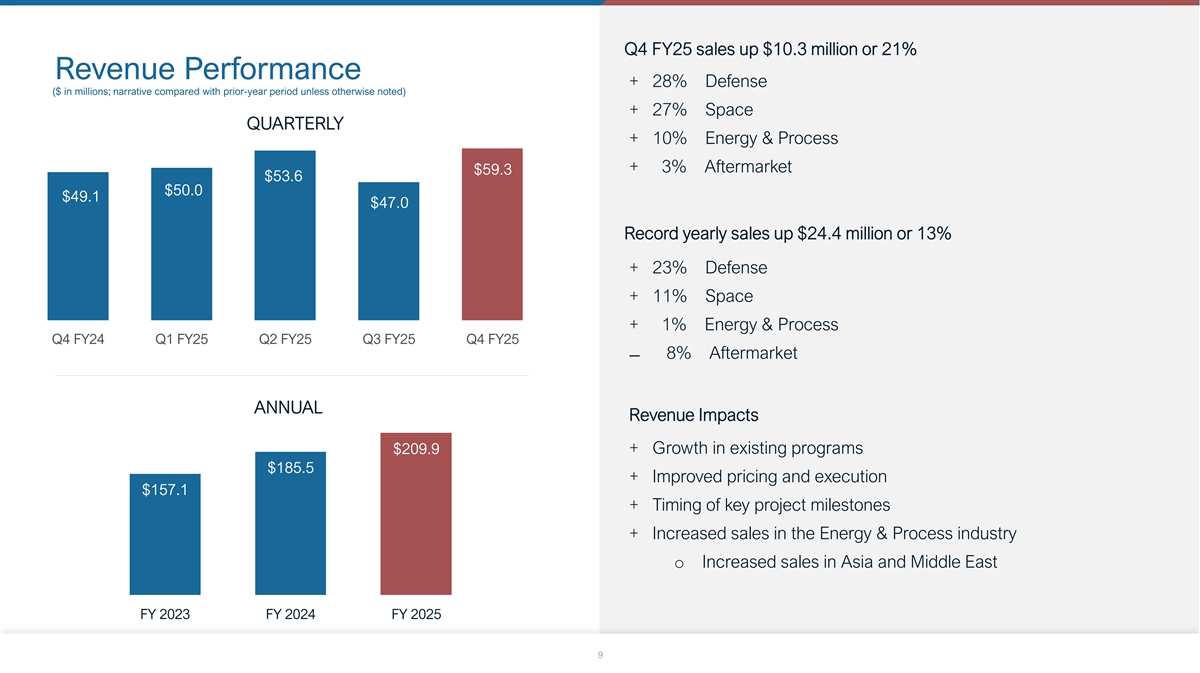
Q4 FY25 sales up $10.3 million or 21% Revenue Performance + 28% Defense ($ in millions; narrative compared with prior-year period unless otherwise noted) + 27% Space QUARTERLY + 10% Energy & Process + 3% Aftermarket $59.3 $53.6 $50.0 $49.1 $47.0 Record yearly sales up $24.4 million or 13% + 23% Defense + 11% Space + 1% Energy & Process Q4 FY24 Q1 FY25 Q2 FY25 Q3 FY25 Q4 FY25 ̶ 8% Aftermarket ANNUAL Revenue Impacts $209.9 + Growth in existing programs $185.5 + Improved pricing and execution $157.1 + Timing of key project milestones + Increased sales in the Energy & Process industry o Increased sales in Asia and Middle East FY 2023 FY 2024 FY 2025 9
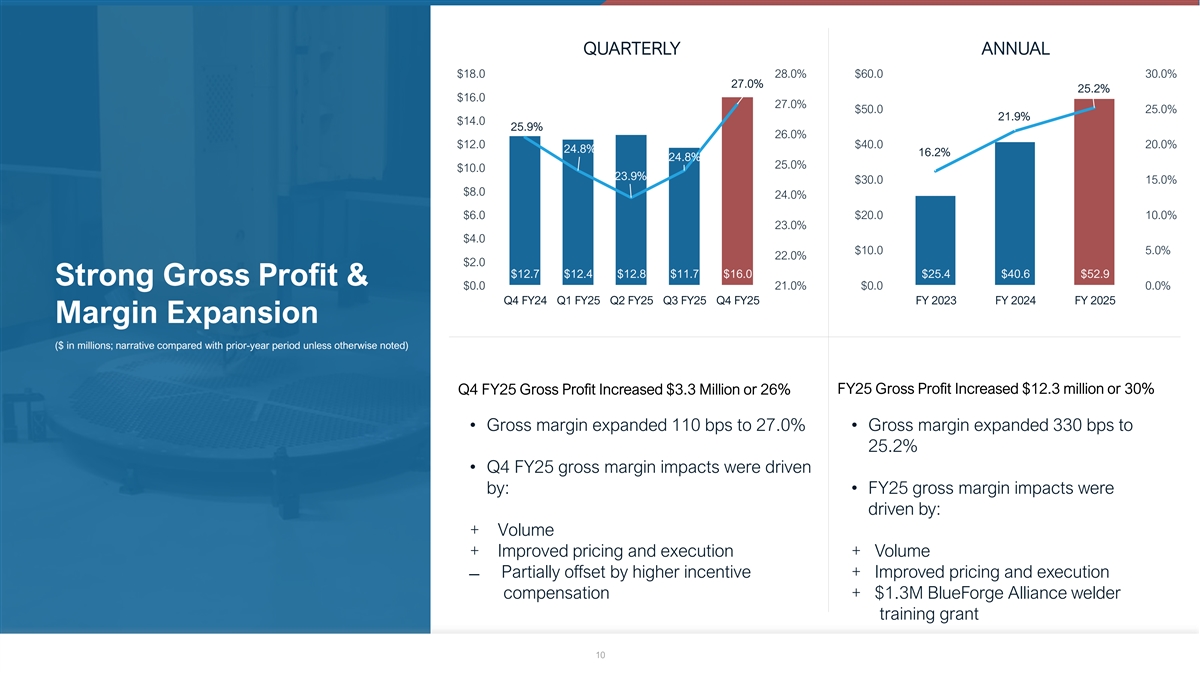
QUARTERLY ANNUAL $18.0 28.0% $60.0 30.0% 27.0% 25.2% $16.0 27.0% $50.0 25.0% 21.9% $14.0 25.9% 26.0% $12.0 $40.0 20.0% 24.8% 16.2% 24.8% 25.0% $10.0 23.9% $30.0 15.0% $8.0 24.0% $6.0 $20.0 10.0% 23.0% $4.0 $10.0 5.0% 22.0% $2.0 $12.7 $12.4 $12.8 $11.7 $16.0 $25.4 $40.6 $52.9 Strong Gross Profit & $0.0 21.0% $0.0 0.0% Q4 FY24 Q1 FY25 Q2 FY25 Q3 FY25 Q4 FY25 FY 2023 FY 2024 FY 2025 Margin Expansion ($ in millions; narrative compared with prior-year period unless otherwise noted) FY25 Gross Profit Increased $12.3 million or 30% Q4 FY25 Gross Profit Increased $3.3 Million or 26% • Gross margin expanded 110 bps to 27.0% • Gross margin expanded 330 bps to 25.2% • Q4 FY25 gross margin impacts were driven by: • FY25 gross margin impacts were driven by: + Volume + Improved pricing and execution + Volume ̶ Partially offset by higher incentive + Improved pricing and execution compensation + $1.3M BlueForge Alliance welder training grant 10
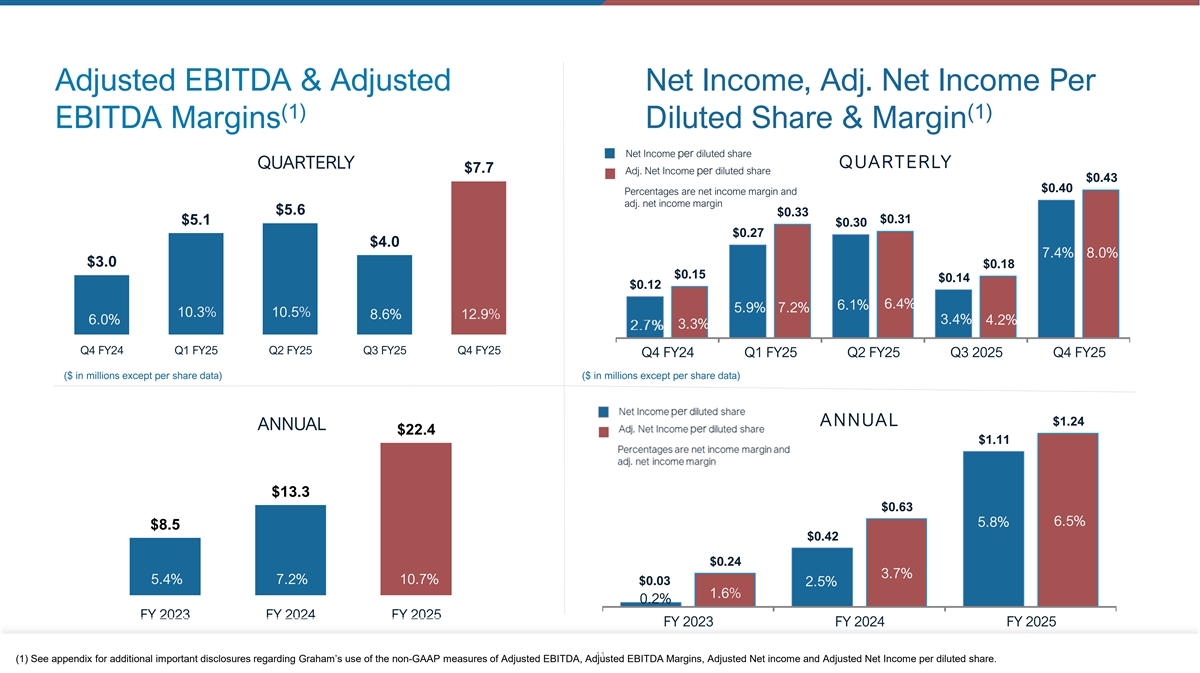
Adjusted EBITDA & Adjusted Net Income, Adj. Net Income Per (1) (1) EBITDA Margins Diluted Share & Margin Net Income per diluted share QUARTERLY QUARTERLY $7.7 Adj. Net Income per diluted share $0.43 $0.40 Percentages are net income margin and adj. net income margin $5.6 $0.33 $0.31 $5.1 $0.30 $0.27 $4.0 7.4% 8.0% $3.0 $0.18 $0.15 $0.14 $0.12 6.4% 6.1% 5.9% 7.2% 10.3% 10.5% 12.9% 8.6% 6.0% 3.4% 4.2% 3.3% Q4 FY24 Q1 FY25 Q2 FY25 Q3 FY25 Q4 FY25 Q4 FY24 Q1 FY25 Q2 FY25 Q3 2025 Q4 FY25 ($ in millions except per share data) ($ in millions except per share data) ANNUAL $1.24 ANNUAL $22.4 $1.11 $13.3 $0.63 6.5% 5.8% $8.5 $0.42 $0.24 3.7% 5.4% 7.2% 10.7% $0.03 2.5% 1.6% 0.2% FY 2023 FY 2024 FY 2025 FY 2023 FY 2024 FY 2025 11 (1) See appendix for additional important disclosures regarding Graham’s use of the non-GAAP measures of Adjusted EBITDA, Adjusted EBITDA Margins, Adjusted Net income and Adjusted Net Income per diluted share.
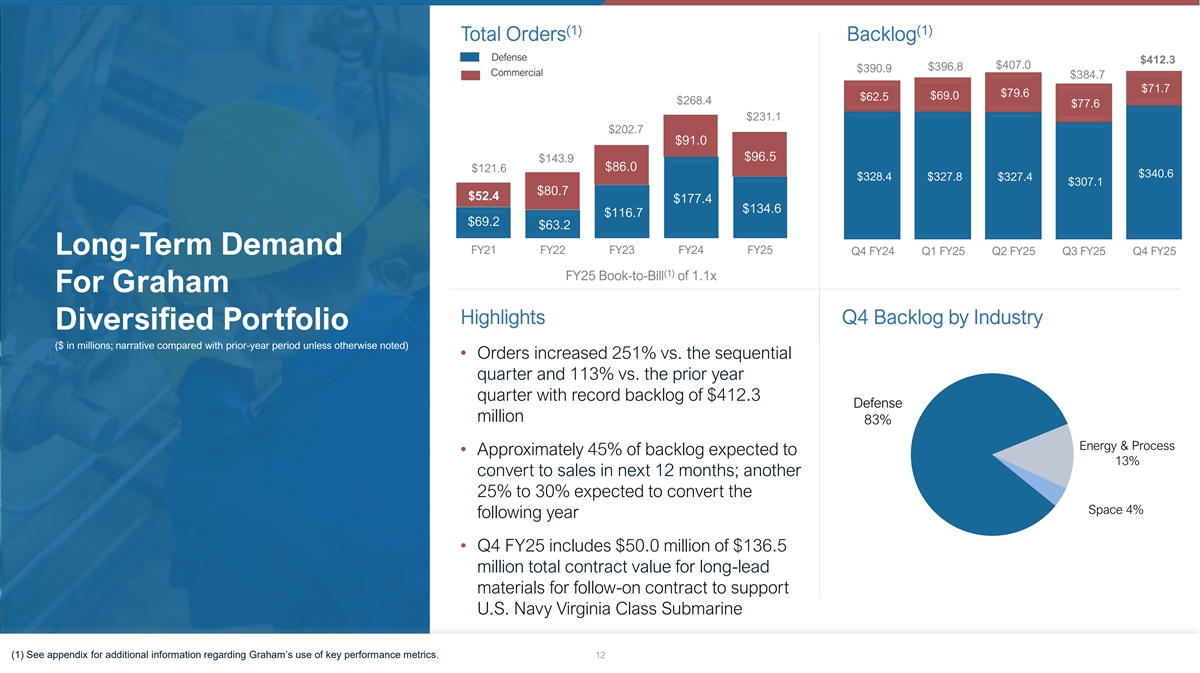
(1) (1) Total Orders Backlog Defense $412.3 $407.0 $396.8 $390.9 Commercial $384.7 $71.7 $79.6 $69.0 $62.5 $268.4 $77.6 $231.1 $202.7 $91.0 $96.5 $143.9 $86.0 $121.6 $340.6 $328.4 $327.8 $327.4 $307.1 $80.7 $52.4 $177.4 $134.6 $116.7 $69.2 $63.2 FY21 FY22 FY23 FY24 FY25 Long-Term Demand Q4 FY24 Q1 FY25 Q2 FY25 Q3 FY25 Q4 FY25 (1) FY25 Book-to-Bill of 1.1x For Graham Highlights Q4 Backlog by Industry Diversified Portfolio ($ in millions; narrative compared with prior-year period unless otherwise noted) • Orders increased 251% vs. the sequential quarter and 113% vs. the prior year quarter with record backlog of $412.3 Defense million 83% Energy & Process • Approximately 45% of backlog expected to 13% convert to sales in next 12 months; another 25% to 30% expected to convert the Space 4% following year • Q4 FY25 includes $50.0 million of $136.5 million total contract value for long-lead materials for follow-on contract to support U.S. Navy Virginia Class Submarine (1) See appendix for additional information regarding Graham’s use of key performance metrics. 12
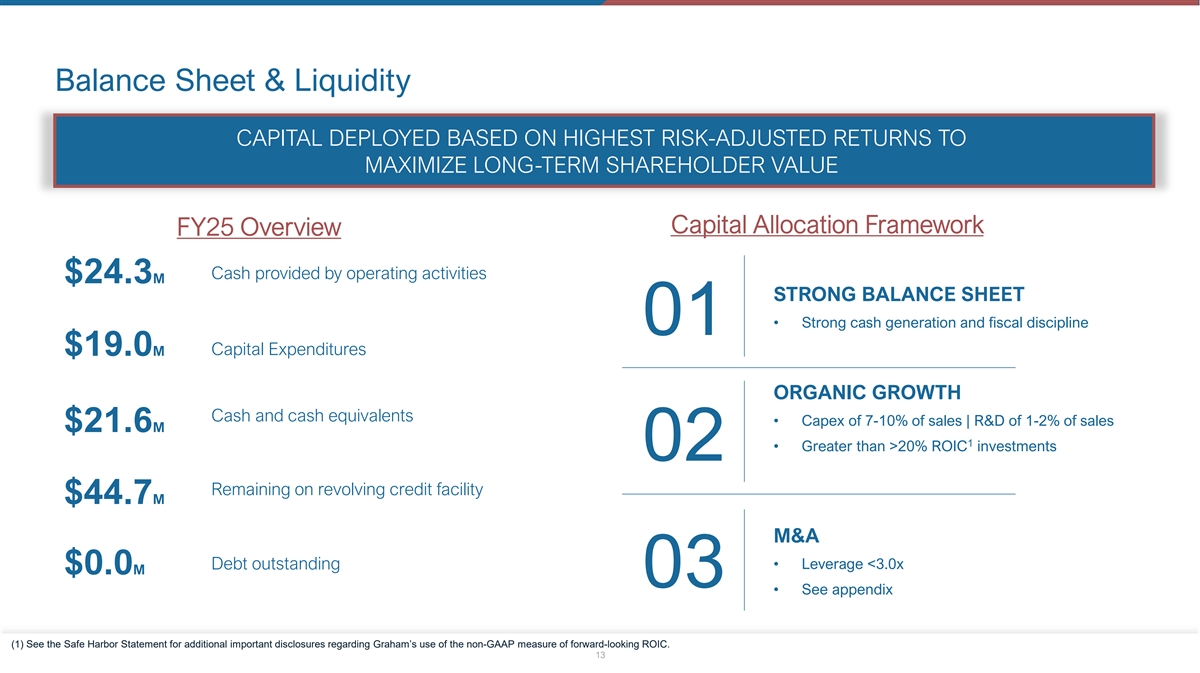
Balance Sheet & Liquidity CAPITAL DEPLOYED BASED ON HIGHEST RISK-ADJUSTED RETURNS TO MAXIMIZE LONG-TERM SHAREHOLDER VALUE Capital Allocation Framework FY25 Overview Cash provided by operating activities $24.3M STRONG BALANCE SHEET • Strong cash generation and fiscal discipline 01 $19.0M Capital Expenditures ORGANIC GROWTH Cash and cash equivalents • Capex of 7-10% of sales | R&D of 1-2% of sales $21.6M 1 • Greater than >20% ROIC investments 02 Remaining on revolving credit facility $44.7M M&A Debt outstanding • Leverage <3.0x $0.0M 03 • See appendix (1) See the Safe Harbor Statement for additional important disclosures regarding Graham’s use of the non-GAAP measure of forward-looking ROIC. 13
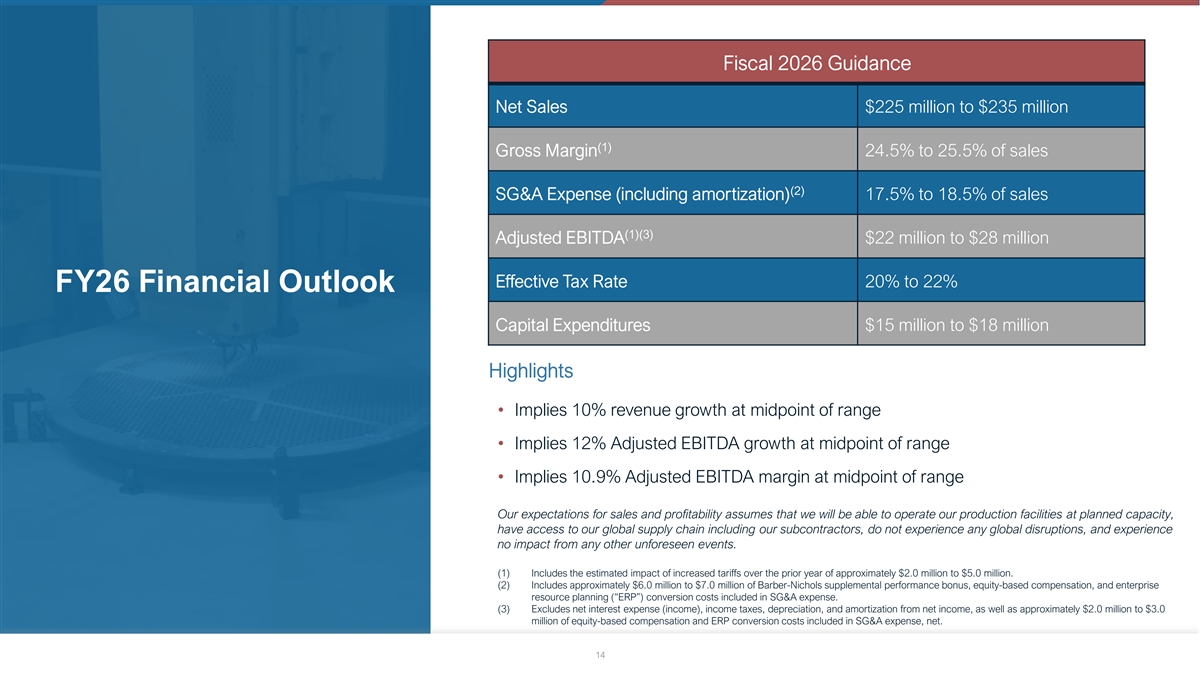
Fiscal 2026 Guidance Net Sales $225 million to $235 million (1) Gross Margin 24.5% to 25.5% of sales (2) SG&A Expense (including amortization) 17.5% to 18.5% of sales (1)(3) Adjusted EBITDA $22 million to $28 million Effective Tax Rate 20% to 22% FY26 Financial Outlook Capital Expenditures $15 million to $18 million Highlights • Implies 10% revenue growth at midpoint of range • Implies 12% Adjusted EBITDA growth at midpoint of range • Implies 10.9% Adjusted EBITDA margin at midpoint of range Our expectations for sales and profitability assumes that we will be able to operate our production facilities at planned capacity, have access to our global supply chain including our subcontractors, do not experience any global disruptions, and experience no impact from any other unforeseen events. (1) Includes the estimated impact of increased tariffs over the prior year of approximately $2.0 million to $5.0 million. (2) Includes approximately $6.0 million to $7.0 million of Barber-Nichols supplemental performance bonus, equity-based compensation, and enterprise resource planning (“ERP”) conversion costs included in SG&A expense. (3) Excludes net interest expense (income), income taxes, depreciation, and amortization from net income, as well as approximately $2.0 million to $3.0 million of equity-based compensation and ERP conversion costs included in SG&A expense, net. 14
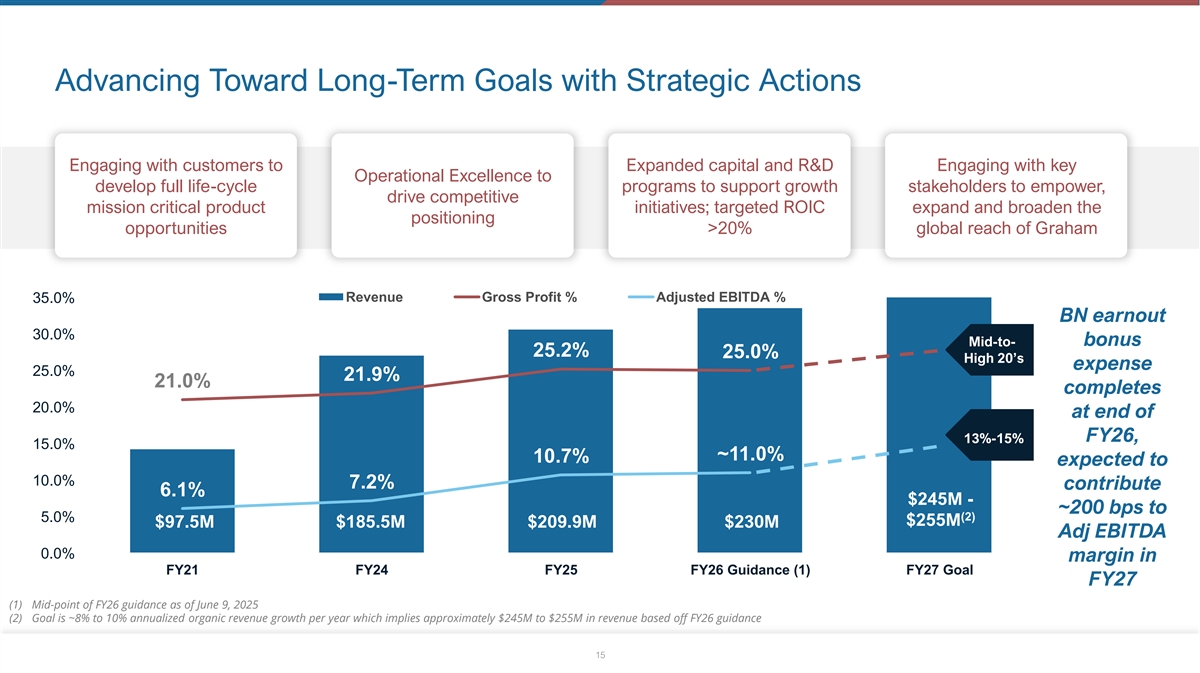
Advancing Toward Long-Term Goals with Strategic Actions Engaging with customers to Expanded capital and R&D Engaging with key Operational Excellence to develop full life-cycle programs to support growth stakeholders to empower, drive competitive mission critical product initiatives; targeted ROIC expand and broaden the positioning opportunities >20% global reach of Graham Revenue Gross Profit % Adjusted EBITDA % 35.0% BN earnout 30.0% bonus Mid-to- 25.2% 25.0% High 20’s expense 25.0% 21.9% 21.0% completes 20.0% at end of FY26, 13%-15% 15.0% ~11.0% 10.7% expected to 10.0% 7.2% contribute 6.1% $245M - ~200 bps to (2) 5.0% $255M $97.5M $185.5M $209.9M $230M Adj EBITDA 0.0% margin in FY21 FY24 FY25 FY26 Guidance (1) FY27 Goal FY27 (1) Mid-point of FY26 guidance as of June 9, 2025 (2) Goal is ~8% to 10% annualized organic revenue growth per year which implies approximately $245M to $255M in revenue based off FY26 guidance 15

Q&A 1 16 6

Appendix 1 17 7
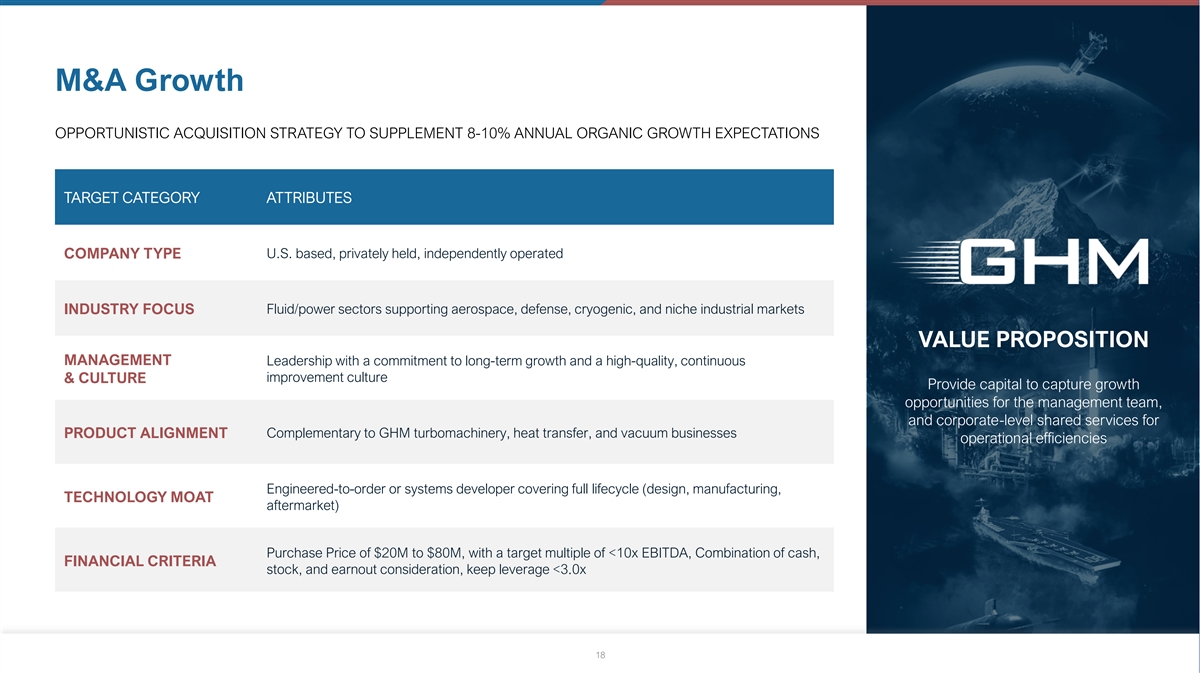
M&A Growth OPPORTUNISTIC ACQUISITION STRATEGY TO SUPPLEMENT 8-10% ANNUAL ORGANIC GROWTH EXPECTATIONS TARGET CATEGORY ATTRIBUTES COMPANY TYPE U.S. based, privately held, independently operated Fluid/power sectors supporting aerospace, defense, cryogenic, and niche industrial markets INDUSTRY FOCUS VALUE PROPOSITION MANAGEMENT Leadership with a commitment to long-term growth and a high-quality, continuous improvement culture & CULTURE Provide capital to capture growth opportunities for the management team, and corporate-level shared services for PRODUCT ALIGNMENT Complementary to GHM turbomachinery, heat transfer, and vacuum businesses operational efficiencies Engineered-to-order or systems developer covering full lifecycle (design, manufacturing, TECHNOLOGY MOAT aftermarket) Purchase Price of $20M to $80M, with a target multiple of <10x EBITDA, Combination of cash, FINANCIAL CRITERIA stock, and earnout consideration, keep leverage <3.0x 18
Key Performance Metrics Key Performance Indicators In addition to the non-GAAP measures used in this presentation, The book-to-bill ratio is an operational measure that management uses to track the growth prospects of the Company. The Company management uses the following key performance metrics to analyze and measure the Company’s financial performance and calculates the book-to-bill ratio for a given period as net orders results of operations: orders, backlog, and book-to-bill ratio. divided by net sales. Management uses orders and backlog as measures of current and future business and financial performance, and these may not be Given that each of orders, backlog, and book-to-bill ratio are comparable with measures provided by other companies. Orders operational measures and that the Company's methodology for represent written communications received from customers calculating orders, backlog, and book-to-bill ratio does not meet requesting the Company to provide products and/or services. the definition of a non-GAAP measure, as that term is defined by Backlog is defined as the total dollar value of net orders received the U.S. Securities and Exchange Commission, a quantitative for which revenue has not yet been recognized. Management reconciliation for each is not required or provided. believes tracking orders and backlog are useful as it often times is a leading indicator of future performance. In accordance with industry practice, contracts may include provisions for cancellation, termination, or suspension at the discretion of the customer. 19
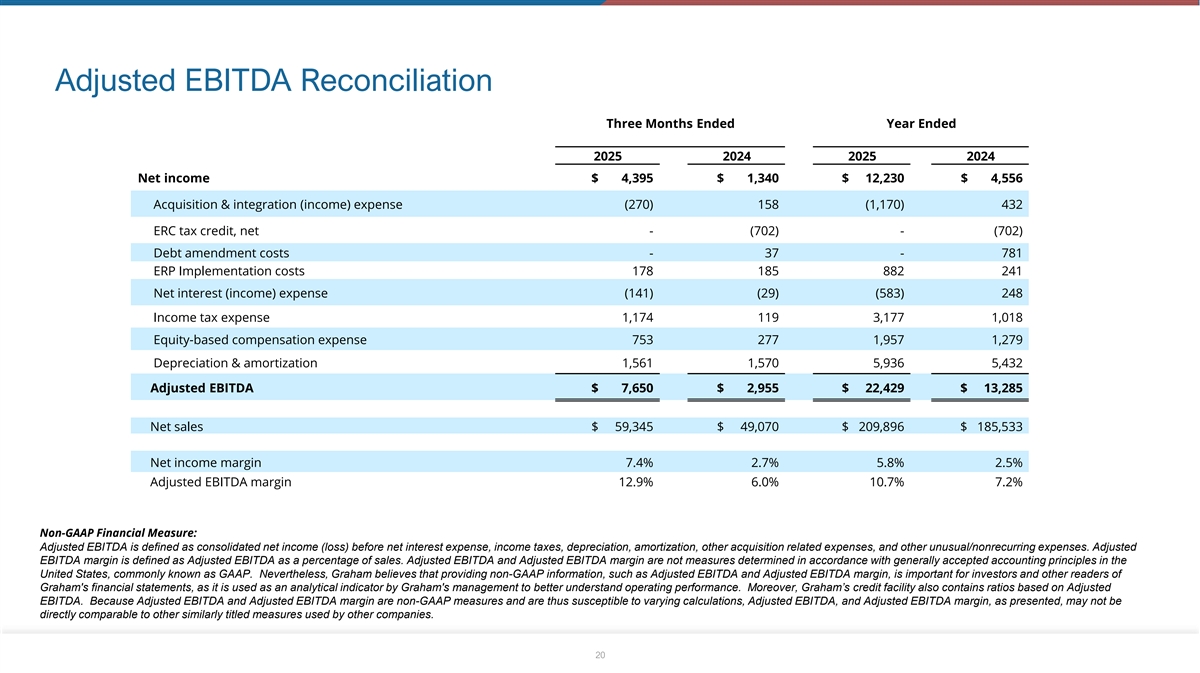
Adjusted EBITDA Reconciliation Adjusted EBITDA Reconciliation (Unaudited, $ in thousands) Three Months Ended Year Ended March 31, March 31, 2025 2024 2025 2024 Net income $ 4,395 $ 1,340 $ 12,230 $ 4,556 Acquisition & integration (income) expense (270) 158 (1,170) 432 ERC tax credit, net - (702) - (702) Debt amendment costs - 37 - 781 ERP Implementation costs 178 185 882 241 Net interest (income) expense (141) (29) (583) 248 Income tax expense 1,174 119 3,177 1,018 Equity-based compensation expense 753 277 1,957 1,279 Depreciation & amortization 1,561 1,570 5,936 5,432 Adjusted EBITDA $ 7,650 $ 2,955 $ 22,429 $ 13,285 Net sales $ 59,345 $ 49,070 $ 209,896 $ 185,533 Net income margin 7.4% 2.7% 5.8% 2.5% Adjusted EBITDA margin 12.9% 6.0% 10.7% 7.2% Non-GAAP Financial Measure: Adjusted EBITDA is defined as consolidated net income (loss) before net interest expense, income taxes, depreciation, amortization, other acquisition related expenses, and other unusual/nonrecurring expenses. Adjusted EBITDA margin is defined as Adjusted EBITDA as a percentage of sales. Adjusted EBITDA and Adjusted EBITDA margin are not measures determined in accordance with generally accepted accounting principles in the United States, commonly known as GAAP. Nevertheless, Graham believes that providing non-GAAP information, such as Adjusted EBITDA and Adjusted EBITDA margin, is important for investors and other readers of Graham's financial statements, as it is used as an analytical indicator by Graham's management to better understand operating performance. Moreover, Graham’s credit facility also contains ratios based on Adjusted EBITDA. Because Adjusted EBITDA and Adjusted EBITDA margin are non-GAAP measures and are thus susceptible to varying calculations, Adjusted EBITDA, and Adjusted EBITDA margin, as presented, may not be directly comparable to other similarly titled measures used by other companies. 20
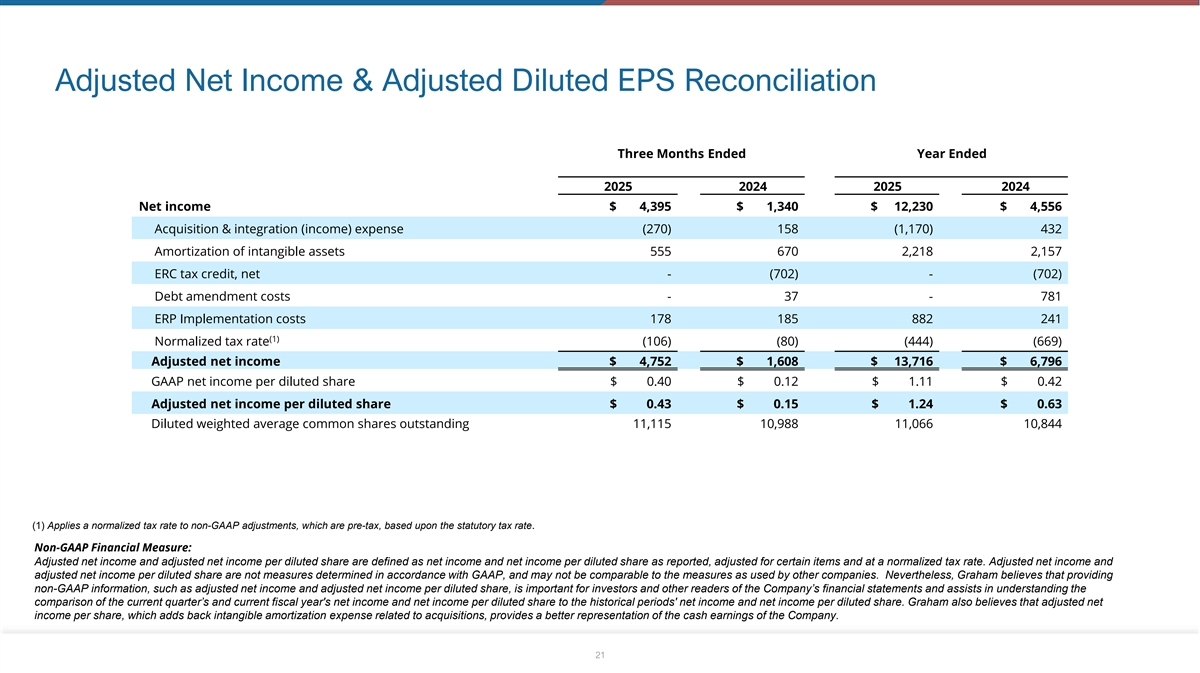
Adjusted Net Income & Adjusted Diluted EPS Reconciliation Three Months Ended Year Ended March 31, March 31, 2025 2024 2025 2024 Net income $ 4,395 $ 1,340 $ 12,230 $ 4,556 Acquisition & integration (income) expense (270) 158 (1,170) 432 Amortization of intangible assets 555 670 2,218 2,157 ERC tax credit, net - (702) - (702) Debt amendment costs - 37 - 781 ERP Implementation costs 178 185 882 241 (1) Normalized tax rate (106) (80) (444) (669) Adjusted net income $ 4,752 $ 1,608 $ 13,716 $ 6,796 GAAP net income per diluted share $ 0.40 $ 0.12 $ 1.11 $ 0.42 Adjusted net income per diluted share $ 0.43 $ 0.15 $ 1.24 $ 0.63 Diluted weighted average common shares outstanding 11,115 10,988 11,066 10,844 (1) Applies a normalized tax rate to non-GAAP adjustments, which are pre-tax, based upon the statutory tax rate. Non-GAAP Financial Measure: Adjusted net income and adjusted net income per diluted share are defined as net income and net income per diluted share as reported, adjusted for certain items and at a normalized tax rate. Adjusted net income and adjusted net income per diluted share are not measures determined in accordance with GAAP, and may not be comparable to the measures as used by other companies. Nevertheless, Graham believes that providing non-GAAP information, such as adjusted net income and adjusted net income per diluted share, is important for investors and other readers of the Company’s financial statements and assists in understanding the comparison of the current quarter’s and current fiscal year's net income and net income per diluted share to the historical periods' net income and net income per diluted share. Graham also believes that adjusted net income per share, which adds back intangible amortization expense related to acquisitions, provides a better representation of the cash earnings of the Company. 21