false--03-31falsefalsefalse0000716314Q3false2025one yearP1Y.333P3Y 2021 2022 2023 2024 2020 2021 2022 2023 20242021 2022 2023 2024 2021 2022 2023 2024http://fasb.org/srt/2025#ChiefExecutiveOfficerMember0000716314us-gaap:AccumulatedTranslationAdjustmentMember2024-04-012024-06-300000716314us-gaap:AccumulatedTranslationAdjustmentMember2025-12-310000716314ghm:EnergyAndProcessMember2024-04-012024-12-310000716314ghm:EnergyAndProcessMember2025-10-012025-12-310000716314us-gaap:EmployeeStockOptionMemberghm:TwoThousandIncentivePlanMember2020-08-112020-08-110000716314us-gaap:ReclassificationOutOfAccumulatedOtherComprehensiveIncomeMemberus-gaap:AccumulatedDefinedBenefitPlansAdjustmentMember2025-10-012025-12-310000716314us-gaap:AccumulatedOtherComprehensiveIncomeMember2025-07-012025-09-300000716314us-gaap:CommonStockMember2025-03-310000716314srt:DirectorMemberghm:TimeVestedRestrictedStockUnitsRsusMember2025-04-012025-12-310000716314ghm:DefenseMember2024-04-012024-12-310000716314us-gaap:AccumulatedDefinedBenefitPlansAdjustmentMember2025-07-012025-09-300000716314srt:MaximumMemberghm:TechnologyAndTechnicalKnowHowMember2025-04-012025-12-310000716314ghm:CustomerDepositsMember2025-12-310000716314us-gaap:AccumulatedTranslationAdjustmentMember2025-06-300000716314ghm:SpaceMember2025-10-012025-12-310000716314us-gaap:CommonStockMember2025-04-012025-06-300000716314us-gaap:AccumulatedOtherComprehensiveIncomeMember2025-09-3000007163142024-06-300000716314us-gaap:RetainedEarningsMember2025-06-300000716314ghm:TimeVestedRestrictedStockUnitsRsusMember2024-10-012024-12-3100007163142025-06-300000716314ghm:OfficersAndKeyEmployeesMemberghm:TimeVestOneThirdPerYearPercentageMember2025-04-012025-12-310000716314ghm:SpaceMember2024-04-012024-12-310000716314us-gaap:AccumulatedOtherComprehensiveIncomeMember2025-06-300000716314us-gaap:AccumulatedOtherComprehensiveIncomeMember2024-10-012024-12-310000716314us-gaap:RetainedEarningsMember2024-09-300000716314ghm:AllOtherCountriesMember2024-04-012024-12-310000716314us-gaap:TreasuryStockCommonMember2024-03-310000716314ghm:OfficersAndKeyEmployeesMemberghm:PerformanceVestOneThirdPerYearPercentageMember2025-04-012025-12-310000716314us-gaap:RestrictedStockUnitsRSUMember2025-10-012025-12-3100007163142024-04-012024-12-3100007163142024-10-012024-12-310000716314us-gaap:RetainedEarningsMember2025-10-012025-12-3100007163142026-04-01srt:MaximumMember2025-12-310000716314us-gaap:CommonStockMember2024-07-012024-09-300000716314srt:AsiaMember2025-04-012025-12-310000716314ghm:TimeVestedRestrictedStockUnitsRsusMember2025-10-012025-12-310000716314srt:SouthAmericaMember2025-10-012025-12-310000716314srt:MinimumMember2023-10-132023-10-130000716314us-gaap:AdditionalPaidInCapitalMember2024-10-012024-12-310000716314us-gaap:AdditionalPaidInCapitalMember2024-12-310000716314us-gaap:RevolvingCreditFacilityMembersrt:MinimumMemberus-gaap:LetterOfCreditMember2025-04-012025-12-310000716314ghm:NewRevolvingCreditFacilityMember2025-12-310000716314us-gaap:TreasuryStockCommonMember2025-03-310000716314ghm:NewRevolvingCreditFacilityMembersrt:MaximumMember2023-10-132023-10-130000716314us-gaap:TreasuryStockCommonMember2024-12-310000716314ghm:AllOtherCountriesMember2025-10-012025-12-310000716314ghm:PerformanceVestedPerformanceStockUnitsPsuMember2025-04-012025-12-310000716314ghm:TimeVestedRestrictedStockUnitsRsusMember2024-04-012024-12-310000716314srt:SouthAmericaMember2024-10-012024-12-310000716314us-gaap:AccumulatedTranslationAdjustmentMember2024-12-310000716314us-gaap:TreasuryStockCommonMember2024-04-012024-06-300000716314us-gaap:AccumulatedDefinedBenefitPlansAdjustmentMember2024-04-012024-06-300000716314ghm:EmployeeStockPurchasePlanMember2025-10-012025-12-310000716314us-gaap:TradeNamesMember2025-04-012025-12-310000716314srt:AsiaMember2025-10-012025-12-310000716314us-gaap:CommonStockMember2024-09-300000716314us-gaap:AccumulatedDefinedBenefitPlansAdjustmentMember2024-06-300000716314srt:MaximumMemberus-gaap:CustomerRelationshipsMember2024-04-012025-03-310000716314us-gaap:RetainedEarningsMember2024-10-012024-12-310000716314us-gaap:AdditionalPaidInCapitalMember2025-04-012025-06-300000716314us-gaap:AccumulatedTranslationAdjustmentMember2024-07-012024-09-3000007163142025-04-012025-12-310000716314us-gaap:LetterOfCreditMember2025-12-310000716314us-gaap:RestrictedStockMember2024-04-012024-12-3100007163142025-03-3100007163142026-02-050000716314ghm:TimeVestedRestrictedStockUnitsRsusMember2025-04-012025-12-310000716314ghm:NewRevolvingCreditFacilityMemberus-gaap:BaseRateMembersrt:MinimumMember2023-10-132023-10-1300007163142024-12-310000716314us-gaap:TradeNamesMember2025-03-310000716314us-gaap:RestrictedStockMember2024-10-012024-12-310000716314ghm:FlackTekMemberus-gaap:SubsequentEventMember2026-01-232026-01-230000716314us-gaap:RetainedEarningsMember2025-03-310000716314us-gaap:RetainedEarningsMember2025-04-012025-06-300000716314us-gaap:TreasuryStockCommonMember2025-06-300000716314us-gaap:RestrictedStockUnitsRSUMember2024-04-012024-12-310000716314us-gaap:ReclassificationOutOfAccumulatedOtherComprehensiveIncomeMemberghm:AccumulatedDefinedBenefitPlansAdjustmentNetActuarialGainLossesMember2025-04-012025-12-310000716314us-gaap:AdditionalPaidInCapitalMember2025-12-310000716314srt:SouthAmericaMember2024-04-012024-12-310000716314ghm:CustomerDepositsMember2025-03-310000716314us-gaap:AccumulatedOtherComprehensiveIncomeMember2024-04-012024-06-3000007163142025-12-310000716314country:US2024-10-012024-12-310000716314ghm:BacklogMember2024-04-012025-03-310000716314country:CA2024-10-012024-12-310000716314ghm:ChinaCiticBankCoLtdMember2025-12-3100007163142026-01-01srt:MaximumMember2025-12-310000716314srt:AsiaMember2024-10-012024-12-310000716314ghm:AllOtherCountriesMember2025-04-012025-12-310000716314ghm:NewRevolvingCreditFacilityMemberus-gaap:SecuredOvernightFinancingRateSofrOvernightIndexSwapRateMembersrt:MinimumMember2023-10-132023-10-130000716314country:CA2025-10-012025-12-310000716314us-gaap:RetainedEarningsMember2024-03-310000716314us-gaap:AccumulatedOtherComprehensiveIncomeMember2025-03-310000716314us-gaap:AccumulatedDefinedBenefitPlansAdjustmentMember2024-10-012024-12-310000716314ghm:EmployeeStockPurchasePlanMember2024-10-012024-12-310000716314us-gaap:RestrictedStockMember2025-10-012025-12-310000716314us-gaap:MiddleEastMember2025-10-012025-12-3100007163142024-04-012024-06-300000716314us-gaap:TreasuryStockCommonMember2024-09-300000716314us-gaap:StockCompensationPlanMembersrt:MaximumMemberghm:TwoThousandIncentivePlanMember2025-12-3100007163142026-01-01srt:MinimumMember2025-12-310000716314us-gaap:AccumulatedDefinedBenefitPlansAdjustmentMember2024-07-012024-09-300000716314ghm:DefenseMember2024-10-012024-12-310000716314us-gaap:AccumulatedDefinedBenefitPlansAdjustmentMember2025-04-012025-06-300000716314us-gaap:RestrictedStockUnitsRSUMember2025-04-012025-12-3100007163142025-09-300000716314us-gaap:TreasuryStockCommonMember2025-09-300000716314country:US2024-04-012024-12-310000716314us-gaap:ReclassificationOutOfAccumulatedOtherComprehensiveIncomeMemberus-gaap:AccumulatedDefinedBenefitPlansAdjustmentMember2024-10-012024-12-310000716314us-gaap:CommonStockMember2024-06-300000716314ghm:DefenseMember2025-04-012025-12-310000716314us-gaap:AccumulatedDefinedBenefitPlansAdjustmentMember2025-12-310000716314ghm:NewRevolvingCreditFacilityMemberus-gaap:SecuredOvernightFinancingRateSofrOvernightIndexSwapRateMember2023-10-132023-10-130000716314us-gaap:CommonStockMember2025-12-310000716314srt:MinimumMemberghm:TechnologyAndTechnicalKnowHowMember2025-04-012025-12-310000716314us-gaap:AccumulatedOtherComprehensiveIncomeMember2024-03-310000716314us-gaap:AccumulatedTranslationAdjustmentMember2024-06-300000716314ghm:XdotBearingTechnologiesMember2025-12-3100007163142025-10-012025-12-310000716314us-gaap:RevolvingCreditFacilityMemberus-gaap:LetterOfCreditMembersrt:MaximumMember2025-04-012025-12-310000716314ghm:OfficersAndKeyEmployeesMemberghm:TimeVestedRestrictedStockUnitsRsusMember2025-04-012025-12-310000716314srt:MaximumMemberghm:TechnologyAndTechnicalKnowHowMember2024-04-012025-03-310000716314us-gaap:AdditionalPaidInCapitalMember2025-06-300000716314us-gaap:RetainedEarningsMember2025-12-310000716314us-gaap:GoodwillMember2025-03-310000716314us-gaap:AdditionalPaidInCapitalMember2024-03-310000716314us-gaap:ReclassificationOutOfAccumulatedOtherComprehensiveIncomeMemberus-gaap:AccumulatedDefinedBenefitPlansAdjustmentMember2025-04-012025-12-310000716314ghm:StockCompensationPriorPlanMemberghm:TwoThousandIncentivePlanMember2025-12-310000716314ghm:SpaceMember2024-10-012024-12-310000716314us-gaap:CommonStockMember2024-03-3100007163142023-10-132023-10-130000716314us-gaap:ForeignCountryMemberus-gaap:MinistryOfFinanceIndiaMember2025-04-012025-12-310000716314us-gaap:ForeignCountryMemberus-gaap:StateAdministrationOfTaxationChinaMember2025-04-012025-12-310000716314us-gaap:AccumulatedDefinedBenefitPlansAdjustmentMember2024-12-310000716314us-gaap:CommonStockMember2024-04-012024-06-300000716314srt:DirectorMemberghm:PerformanceVestedPerformanceStockUnitsPsuMember2025-04-012025-12-310000716314us-gaap:CommonStockMember2024-12-310000716314us-gaap:StateAndLocalJurisdictionMember2025-04-012025-12-310000716314us-gaap:RetainedEarningsMember2024-06-300000716314us-gaap:AccumulatedOtherComprehensiveIncomeMember2024-06-300000716314ghm:EmployeeStockPurchasePlanMember2025-12-310000716314us-gaap:AccumulatedDefinedBenefitPlansAdjustmentMember2024-03-310000716314us-gaap:TreasuryStockCommonMember2024-07-012024-09-300000716314ghm:EmployeeStockPurchasePlanMember2025-04-012025-12-310000716314us-gaap:AccumulatedTranslationAdjustmentMember2025-10-012025-12-310000716314us-gaap:AccumulatedOtherComprehensiveIncomeMember2024-07-012024-09-300000716314ghm:TechnologyAndTechnicalKnowHowMember2025-12-310000716314ghm:OfficersAndKeyEmployeesMemberghm:TimeVestedRestrictedStockUnitsRsusMember2024-04-012024-12-310000716314ghm:XdotBearingTechnologiesMember2025-04-012025-12-310000716314us-gaap:TradeNamesMember2024-04-012025-03-310000716314ghm:OfficersAndKeyEmployeesMemberghm:PerformanceVestedPerformanceStockUnitsPsuMember2025-04-012025-12-310000716314ghm:OfficersAndKeyEmployeesMember2025-04-012025-12-310000716314us-gaap:RetainedEarningsMember2024-04-012024-06-300000716314ghm:EnergyAndProcessMember2025-04-012025-12-310000716314us-gaap:AccumulatedTranslationAdjustmentMember2025-04-012025-06-300000716314ghm:OfficersAndKeyEmployeesMemberghm:PerformanceVestOneThirdPerYearPercentageMember2024-04-012024-12-310000716314country:CA2024-04-012024-12-310000716314us-gaap:AccumulatedOtherComprehensiveIncomeMember2025-04-012025-06-300000716314ghm:NewRevolvingCreditFacilityMember2023-10-132023-10-130000716314ghm:PerformanceVestedRestrictedStockMember2024-10-012024-12-310000716314us-gaap:CustomerRelationshipsMember2025-03-310000716314us-gaap:AdditionalPaidInCapitalMember2024-07-012024-09-300000716314us-gaap:CommonStockMember2025-06-300000716314ghm:AxisBankMember2025-12-310000716314us-gaap:AccumulatedDefinedBenefitPlansAdjustmentMember2025-10-012025-12-310000716314us-gaap:AdditionalPaidInCapitalMember2025-07-012025-09-300000716314ghm:OfficersAndKeyEmployeesMemberghm:TimeVestOneThirdPerYearPercentageMember2024-04-012024-12-310000716314us-gaap:GoodwillMember2025-04-012025-12-310000716314us-gaap:RetainedEarningsMember2024-07-012024-09-300000716314srt:AsiaMember2024-04-012024-12-310000716314us-gaap:ReclassificationOutOfAccumulatedOtherComprehensiveIncomeMemberghm:AccumulatedDefinedBenefitPlansAdjustmentNetActuarialGainLossesMember2024-04-012024-12-310000716314us-gaap:AccumulatedTranslationAdjustmentMember2025-09-300000716314us-gaap:AccumulatedDefinedBenefitPlansAdjustmentMember2025-09-300000716314us-gaap:MiddleEastMember2025-04-012025-12-3100007163142026-04-012025-12-310000716314ghm:FlackTekMemberus-gaap:SubsequentEventMember2026-01-230000716314srt:MaximumMember2023-10-132023-10-130000716314us-gaap:AccumulatedTranslationAdjustmentMember2024-03-310000716314us-gaap:TradeNamesMember2025-12-310000716314srt:SouthAmericaMember2025-04-012025-12-310000716314srt:MinimumMemberghm:TechnologyAndTechnicalKnowHowMember2024-04-012025-03-310000716314us-gaap:TreasuryStockCommonMember2025-12-310000716314us-gaap:AdditionalPaidInCapitalMember2024-06-300000716314us-gaap:AccumulatedOtherComprehensiveIncomeMember2025-12-310000716314srt:MinimumMemberus-gaap:CustomerRelationshipsMember2024-04-012025-03-310000716314ghm:HSBCBankUSAMember2025-12-310000716314us-gaap:RevolvingCreditFacilityMember2025-12-310000716314us-gaap:DomesticCountryMember2025-04-012025-12-310000716314ghm:EmployeeStockPurchasePlanMember2025-04-012025-12-310000716314us-gaap:LetterOfCreditMember2025-03-310000716314us-gaap:CommonStockMember2025-07-012025-09-300000716314us-gaap:RevolvingCreditFacilityMemberus-gaap:SubsequentEventMember2026-01-230000716314srt:DirectorMember2025-04-012025-12-3100007163142024-03-310000716314us-gaap:AccumulatedOtherComprehensiveIncomeMember2024-12-310000716314srt:DirectorMemberghm:TimeVestedRestrictedStockUnitsRsusMember2024-04-012024-12-3100007163142025-04-012025-06-300000716314us-gaap:AccumulatedDefinedBenefitPlansAdjustmentMember2025-03-310000716314ghm:SpaceMember2025-04-012025-12-310000716314us-gaap:MiddleEastMember2024-04-012024-12-310000716314country:US2025-10-012025-12-310000716314us-gaap:AccumulatedTranslationAdjustmentMember2024-09-300000716314ghm:DefenseMember2025-10-012025-12-310000716314ghm:BacklogMember2025-03-310000716314us-gaap:AdditionalPaidInCapitalMember2024-09-300000716314us-gaap:RestrictedStockUnitsRSUMember2024-10-012024-12-310000716314ghm:XdotBearingTechnologiesMember2025-10-200000716314ghm:NewRevolvingCreditFacilityMemberus-gaap:BaseRateMember2023-10-132023-10-130000716314us-gaap:RetainedEarningsMember2024-12-310000716314srt:DirectorMemberghm:PerformanceVestedPerformanceStockUnitsPsuMember2024-04-012024-12-310000716314us-gaap:GoodwillMember2024-04-012025-03-310000716314us-gaap:RetainedEarningsMember2025-07-012025-09-300000716314us-gaap:LetterOfCreditMemberus-gaap:SubsequentEventMembersrt:MaximumMember2026-01-230000716314ghm:EmployeeStockPurchasePlanMember2024-04-012024-12-310000716314us-gaap:AccumulatedDefinedBenefitPlansAdjustmentMember2024-09-300000716314us-gaap:AccumulatedOtherComprehensiveIncomeMember2024-09-300000716314us-gaap:CustomerRelationshipsMember2025-12-310000716314country:CA2025-04-012025-12-310000716314ghm:PerformanceVestedPerformanceStockUnitsPsuMember2024-04-012024-12-310000716314us-gaap:AdditionalPaidInCapitalMember2025-03-310000716314us-gaap:CommonStockMember2025-09-300000716314ghm:PerformanceVestedRestrictedStockMember2025-10-012025-12-310000716314ghm:OfficersAndKeyEmployeesMemberghm:PerformanceVestedPerformanceStockUnitsPsuMember2024-04-012024-12-310000716314ghm:AllOtherCountriesMember2024-10-012024-12-310000716314us-gaap:AccumulatedTranslationAdjustmentMember2024-10-012024-12-310000716314srt:MinimumMemberus-gaap:CustomerRelationshipsMember2025-04-012025-12-310000716314us-gaap:TreasuryStockCommonMember2024-06-300000716314us-gaap:RevolvingCreditFacilityMemberus-gaap:LetterOfCreditMember2023-10-1300007163142024-07-012024-09-300000716314ghm:TechnologyAndTechnicalKnowHowMember2025-03-3100007163142025-07-012025-09-300000716314us-gaap:RestrictedStockMember2025-04-012025-12-310000716314ghm:NewRevolvingCreditFacilityMemberus-gaap:SecuredOvernightFinancingRateSofrOvernightIndexSwapRateMembersrt:MaximumMember2023-10-132023-10-130000716314us-gaap:AccumulatedTranslationAdjustmentMember2025-03-310000716314ghm:EnergyAndProcessMember2024-10-012024-12-310000716314us-gaap:CustomerRelationshipsMembersrt:MaximumMember2025-04-012025-12-310000716314us-gaap:AdditionalPaidInCapitalMember2025-09-300000716314ghm:NewRevolvingCreditFacilityMembersrt:MinimumMember2023-10-132023-10-130000716314ghm:XdotBearingTechnologiesMemberghm:TechnologyAndTechnicalKnowHowMember2025-12-310000716314us-gaap:AccumulatedDefinedBenefitPlansAdjustmentMember2025-06-3000007163142026-04-01srt:MinimumMember2025-12-310000716314ghm:XdotBearingTechnologiesMember2025-10-202025-10-200000716314us-gaap:RevolvingCreditFacilityMember2023-10-130000716314ghm:XdotBearingTechnologiesMember2025-10-012025-12-310000716314country:US2025-04-012025-12-310000716314us-gaap:AdditionalPaidInCapitalMember2024-04-012024-06-300000716314us-gaap:GoodwillMember2025-12-3100007163142024-09-300000716314us-gaap:AccumulatedTranslationAdjustmentMember2025-07-012025-09-300000716314us-gaap:ReclassificationOutOfAccumulatedOtherComprehensiveIncomeMemberghm:AccumulatedDefinedBenefitPlansAdjustmentNetActuarialGainLossesMember2025-10-012025-12-310000716314us-gaap:AdditionalPaidInCapitalMember2025-10-012025-12-310000716314ghm:NewRevolvingCreditFacilityMemberus-gaap:SecuredOvernightFinancingRateSofrOvernightIndexSwapRateMember2025-04-012025-12-310000716314us-gaap:ReclassificationOutOfAccumulatedOtherComprehensiveIncomeMemberus-gaap:AccumulatedDefinedBenefitPlansAdjustmentMember2024-04-012024-12-310000716314us-gaap:AccumulatedOtherComprehensiveIncomeMember2025-10-012025-12-310000716314us-gaap:ReclassificationOutOfAccumulatedOtherComprehensiveIncomeMemberghm:AccumulatedDefinedBenefitPlansAdjustmentNetActuarialGainLossesMember2024-10-012024-12-310000716314us-gaap:MiddleEastMember2024-10-012024-12-310000716314us-gaap:LetterOfCreditMember2025-04-012025-12-310000716314ghm:NewRevolvingCreditFacilityMemberus-gaap:BaseRateMembersrt:MaximumMember2023-10-132023-10-130000716314us-gaap:RetainedEarningsMember2025-09-30xbrli:pureghm:Segmentxbrli:sharesiso4217:CNYiso4217:USD
UNITED STATES
SECURITIES AND EXCHANGE COMMISSION
WASHINGTON, D.C. 20549
FORM 10-Q
(Mark One)
☒ QUARTERLY REPORT PURSUANT TO SECTION 13 OR 15(d) OF THE SECURITIES EXCHANGE ACT OF 1934
For the quarterly period ended December 31, 2025
or
☐ TRANSITION REPORT PURSUANT TO SECTION 13 OR 15(d) OF THE SECURITIES EXCHANGE ACT OF 1934
For the transition period from _____________ to ___________
Commission File Number 001-08462
GRAHAM CORPORATION
(Exact name of registrant as specified in its charter)
|
|
Delaware |
16-1194720 |
(State or other jurisdiction of incorporation or organization) |
(I.R.S. Employer Identification No.) |
20 Florence Avenue, Batavia, New York |
14020 |
(Address of principal executive offices) |
(Zip Code) |
585-343-2216
(Registrant's telephone number, including area code)
Securities registered pursuant to Section 12(b) of the Act:
|
|
|
|
|
Title of each class |
|
Trading Symbol(s) |
|
Name of each exchange on which registered |
Common Stock, Par Value $0.10 Per Share |
|
GHM |
|
NYSE |
Indicate by check mark whether the registrant (1) has filed all reports required to be filed by Section 13 or 15(d) of the Securities Exchange Act of 1934 during the preceding 12 months (or for such shorter period that the registrant was required to file such reports), and (2) has been subject to such filing requirements for the past 90 days. Yes ☒ No ☐
Indicate by check mark whether the registrant has submitted electronically every Interactive Data File required to be submitted pursuant to Rule 405 of Regulation S-T (§232.405 of this chapter) during the preceding 12 months (or for such shorter period that the registrant was required to submit such files). Yes ☒ No ☐
Indicate by check mark whether the registrant is a large accelerated filer, an accelerated filer, a non-accelerated filer, a smaller reporting company, or an emerging growth company. See the definitions of "large accelerated filer," "accelerated filer," "smaller reporting company," and "emerging growth company" in Rule 12b-2 of the Exchange Act.
|
|
|
|
|
Large accelerated filer |
☐ |
|
Accelerated filer |
☒ |
Non-accelerated filer |
☐ |
|
Smaller reporting company |
☐ |
Emerging growth company |
☐ |
|
|
|
If an emerging growth company, indicate by check mark if the registrant has elected not to use the extended transition period for complying with any new or revised financial accounting standards provided pursuant to Section 13(a) of the Exchange Act. ☐
Indicate by check mark whether the registrant is a shell company (as defined in Rule 12b-2 of the Exchange Act).
Yes ☐ No ☒
As of February 5, 2026, there were outstanding 11,072,780 shares of the registrant’s common stock, par value $0.10 per share.
Graham Corporation and Subsidiaries
Index to Form 10-Q
As of December 31, 2025 and March 31, 2025 and for the three and nine months ended December 31, 2025 and 2024
GRAHAM CORPORATION AND SUBSIDIARIES
FORM 10-Q
DECEMBER 31, 2025
PART I – FINANCIAL INFORMATION
Item 1. Unaudited Condensed Consolidated Financial Statements
GRAHAM CORPORATION AND SUBSIDIARIES
CONDENSED CONSOLIDATED STATEMENTS OF OPERATIONS
(Dollar amounts in thousands, except per share data)
(Unaudited)
|
|
|
|
|
|
|
|
|
|
|
|
|
|
|
|
|
|
|
Three Months Ended |
|
|
Nine Months Ended |
|
|
|
December 31, |
|
|
December 31, |
|
|
|
2025 |
|
|
2024 |
|
|
2025 |
|
|
2024 |
|
Net sales |
|
$ |
56,701 |
|
|
$ |
47,037 |
|
|
$ |
178,215 |
|
|
$ |
150,551 |
|
Cost of products sold |
|
|
43,232 |
|
|
|
35,351 |
|
|
|
135,719 |
|
|
|
113,698 |
|
Gross profit |
|
|
13,469 |
|
|
|
11,686 |
|
|
|
42,496 |
|
|
|
36,853 |
|
Other operating expenses and income: |
|
|
|
|
|
|
|
|
|
|
|
|
Selling, general and administrative |
|
|
10,129 |
|
|
|
9,260 |
|
|
|
29,315 |
|
|
|
26,821 |
|
Selling, general and administrative – amortization |
|
|
435 |
|
|
|
436 |
|
|
|
1,308 |
|
|
|
1,309 |
|
Other operating income |
|
|
(219 |
) |
|
|
(220 |
) |
|
|
(486 |
) |
|
|
(946 |
) |
Operating income |
|
|
3,124 |
|
|
|
2,210 |
|
|
|
12,359 |
|
|
|
9,669 |
|
Other expense, net |
|
|
90 |
|
|
|
91 |
|
|
|
334 |
|
|
|
273 |
|
Interest income, net |
|
|
(169 |
) |
|
|
(128 |
) |
|
|
(414 |
) |
|
|
(442 |
) |
Income before provision for income taxes |
|
|
3,203 |
|
|
|
2,247 |
|
|
|
12,439 |
|
|
|
9,838 |
|
Provision for income taxes |
|
|
358 |
|
|
|
659 |
|
|
|
1,909 |
|
|
|
2,003 |
|
Net income |
|
$ |
2,845 |
|
|
$ |
1,588 |
|
|
$ |
10,530 |
|
|
$ |
7,835 |
|
Per share data |
|
|
|
|
|
|
|
|
|
|
|
|
Basic: |
|
|
|
|
|
|
|
|
|
|
|
|
Net income |
|
$ |
0.26 |
|
|
$ |
0.15 |
|
|
$ |
0.96 |
|
|
$ |
0.72 |
|
Diluted: |
|
|
|
|
|
|
|
|
|
|
|
|
Net income |
|
$ |
0.25 |
|
|
$ |
0.14 |
|
|
$ |
0.95 |
|
|
$ |
0.71 |
|
Weighted average common shares
outstanding: |
|
|
|
|
|
|
|
|
|
|
|
|
Basic |
|
|
10,988 |
|
|
|
10,890 |
|
|
|
10,967 |
|
|
|
10,880 |
|
Diluted |
|
|
11,157 |
|
|
|
11,057 |
|
|
|
11,108 |
|
|
|
11,016 |
|
See Notes to Condensed Consolidated Financial Statements.
GRAHAM CORPORATION AND SUBSIDIARIES
CONDENSED CONSOLIDATED STATEMENTS OF COMPREHENSIVE INCOME
(Dollar amounts in thousands)
(Unaudited)
|
|
|
|
|
|
|
|
|
|
|
|
|
|
|
|
|
|
|
Three Months Ended |
|
|
Nine Months Ended |
|
|
|
December 31, |
|
|
December 31, |
|
|
|
2025 |
|
|
2024 |
|
|
2025 |
|
|
2024 |
|
Net income |
|
$ |
2,845 |
|
|
$ |
1,588 |
|
|
$ |
10,530 |
|
|
$ |
7,835 |
|
Other comprehensive (expense) income: |
|
|
|
|
|
|
|
|
|
|
|
|
Foreign currency translation adjustment |
|
|
72 |
|
|
|
(208 |
) |
|
|
66 |
|
|
|
(105 |
) |
Defined benefit pension and other postretirement plans net
of income tax expense of $48 and $45 for the three months ended December 31, 2025 and 2024, respectively, and $146 and $135 for the nine months ended December 31, 2025 and 2024, respectively |
|
|
161 |
|
|
|
151 |
|
|
|
484 |
|
|
|
451 |
|
Total other comprehensive income |
|
|
233 |
|
|
|
(57 |
) |
|
|
550 |
|
|
|
346 |
|
Total comprehensive income |
|
$ |
3,078 |
|
|
$ |
1,531 |
|
|
$ |
11,080 |
|
|
$ |
8,181 |
|
See Notes to Condensed Consolidated Financial Statements.
GRAHAM CORPORATION AND SUBSIDIARIES
CONDENSED CONSOLIDATED BALANCE SHEETS
(Dollar amounts in thousands, except per share data)
(Unaudited)
|
|
|
|
|
|
|
|
|
|
|
December 31, 2025 |
|
|
March 31, 2025 |
|
Assets |
|
|
|
|
|
|
Current assets: |
|
|
|
|
|
|
Cash and cash equivalents |
|
$ |
22,254 |
|
|
$ |
21,577 |
|
Trade accounts receivable, net of allowances ($360 and $630 at December 31 and
March 31, 2025, respectively) |
|
|
31,704 |
|
|
|
35,507 |
|
Unbilled revenue |
|
|
57,823 |
|
|
|
38,494 |
|
Inventories |
|
|
48,523 |
|
|
|
40,025 |
|
Prepaid expenses and other current assets |
|
|
3,491 |
|
|
|
4,249 |
|
Income taxes receivable |
|
|
19 |
|
|
|
1,520 |
|
Total current assets |
|
|
163,814 |
|
|
|
141,372 |
|
Property, plant and equipment, net |
|
|
57,321 |
|
|
|
50,649 |
|
Prepaid pension asset |
|
|
6,055 |
|
|
|
5,950 |
|
Operating lease assets |
|
|
5,587 |
|
|
|
6,386 |
|
Goodwill |
|
|
26,181 |
|
|
|
25,520 |
|
Customer relationships, net |
|
|
12,304 |
|
|
|
13,159 |
|
Technology and technical know-how, net |
|
|
10,383 |
|
|
|
10,310 |
|
Tradenames, net |
|
|
6,783 |
|
|
|
6,858 |
|
Deferred income tax asset |
|
|
1,531 |
|
|
|
1,502 |
|
Other assets |
|
|
2,968 |
|
|
|
2,404 |
|
Total assets |
|
$ |
292,927 |
|
|
$ |
264,110 |
|
Liabilities and stockholders’ equity |
|
|
|
|
|
|
Current liabilities: |
|
|
|
|
|
|
Current portion of finance lease obligations |
|
$ |
23 |
|
|
$ |
21 |
|
Accounts payable |
|
|
17,509 |
|
|
|
27,309 |
|
Accrued compensation |
|
|
18,503 |
|
|
|
19,161 |
|
Accrued expenses and other current liabilities |
|
|
4,530 |
|
|
|
4,322 |
|
Customer deposits |
|
|
111,984 |
|
|
|
84,062 |
|
Operating lease liabilities |
|
|
1,460 |
|
|
|
1,275 |
|
Income taxes payable |
|
|
660 |
|
|
|
— |
|
Total current liabilities |
|
|
154,669 |
|
|
|
136,150 |
|
Finance lease obligations |
|
|
27 |
|
|
|
44 |
|
Operating lease liabilities |
|
|
4,544 |
|
|
|
5,514 |
|
Deferred income tax liability |
|
|
74 |
|
|
|
— |
|
Accrued pension and postretirement benefit liabilities |
|
|
1,191 |
|
|
|
1,192 |
|
Other long-term liabilities |
|
|
1,112 |
|
|
|
1,633 |
|
Total liabilities |
|
|
161,617 |
|
|
|
144,533 |
|
Commitments and contingencies (Note 10) |
|
|
|
|
|
|
Stockholders’ equity: |
|
|
|
|
|
|
Preferred stock, $1.00 par value, 500 shares authorized |
|
|
— |
|
|
|
— |
|
Common stock, $0.10 par value, 25,500 shares authorized, 11,162 and 11,077 shares
issued and 10,988 and 10,903 shares outstanding at December 31 and March 31, 2025,
respectively |
|
|
1,116 |
|
|
|
1,107 |
|
Capital in excess of par value |
|
|
35,260 |
|
|
|
34,616 |
|
Retained earnings |
|
|
104,759 |
|
|
|
94,229 |
|
Accumulated other comprehensive loss |
|
|
(6,437 |
) |
|
|
(6,987 |
) |
Treasury stock (174 shares at December 31 and March 31, 2025) |
|
|
(3,388 |
) |
|
|
(3,388 |
) |
Total stockholders’ equity |
|
|
131,310 |
|
|
|
119,577 |
|
Total liabilities and stockholders’ equity |
|
$ |
292,927 |
|
|
$ |
264,110 |
|
See Notes to Condensed Consolidated Financial Statements.
GRAHAM CORPORATION AND SUBSIDIARIES
CONDENSED CONSOLIDATED STATEMENTS OF CASH FLOWS
(Dollar amounts in thousands)
(Unaudited)
|
|
|
|
|
|
|
|
|
|
|
Nine Months Ended |
|
|
|
December 31, |
|
|
|
2025 |
|
|
2024 |
|
Operating activities: |
|
|
|
Net income |
|
$ |
10,530 |
|
|
$ |
7,835 |
|
Adjustments to reconcile net income to net cash provided by operating
activities: |
|
|
|
|
|
|
Depreciation |
|
|
3,670 |
|
|
|
2,712 |
|
Amortization of intangible assets |
|
|
1,507 |
|
|
|
1,663 |
|
Bad debt reserves |
|
|
(369 |
) |
|
|
— |
|
Amortization of actuarial losses |
|
|
630 |
|
|
|
586 |
|
Equity-based compensation expense |
|
|
1,727 |
|
|
|
1,204 |
|
Gain on disposal or sale of property, plant and equipment |
|
|
(38 |
) |
|
|
— |
|
Change in fair value of contingent consideration |
|
|
(486 |
) |
|
|
(946 |
) |
Deferred income taxes |
|
|
(39 |
) |
|
|
(91 |
) |
(Increase) decrease in operating assets, net of acquisition: |
|
|
|
|
|
|
Accounts receivable |
|
|
4,169 |
|
|
|
9,394 |
|
Unbilled revenue |
|
|
(19,308 |
) |
|
|
(9,879 |
) |
Inventories |
|
|
(8,474 |
) |
|
|
(5,628 |
) |
Prepaid expenses and other current and non-current assets |
|
|
4 |
|
|
|
(1,665 |
) |
Income taxes receivable |
|
|
1,501 |
|
|
|
(46 |
) |
Operating lease assets |
|
|
1,011 |
|
|
|
965 |
|
Prepaid pension asset |
|
|
(105 |
) |
|
|
(175 |
) |
Increase (decrease) in operating liabilities, net of acquisition: |
|
|
|
|
|
|
Accounts payable |
|
|
(6,690 |
) |
|
|
3,914 |
|
Accrued compensation, accrued expenses and other current and non-current
liabilities |
|
|
(551 |
) |
|
|
(1,380 |
) |
Customer deposits |
|
|
27,830 |
|
|
|
21,000 |
|
Income taxes payable |
|
|
562 |
|
|
|
(646 |
) |
Operating lease liabilities |
|
|
(995 |
) |
|
|
(948 |
) |
Long-term portion of accrued compensation, accrued pension and
postretirement benefit liabilities |
|
|
(2 |
) |
|
|
4 |
|
Net cash provided by operating activities |
|
|
16,084 |
|
|
|
27,873 |
|
Investing activities: |
|
|
|
|
|
|
Purchase of property, plant and equipment |
|
|
(13,482 |
) |
|
|
(13,800 |
) |
Proceeds from disposal of property, plant and equipment |
|
|
154 |
|
|
|
— |
|
Acquisitions, net of cash acquired |
|
|
(895 |
) |
|
|
(170 |
) |
Net cash used by investing activities |
|
|
(14,223 |
) |
|
|
(13,970 |
) |
Financing activities: |
|
|
|
|
|
|
Borrowings of debt obligations |
|
|
8,000 |
|
|
|
— |
|
Principal repayments on debt |
|
|
(8,000 |
) |
|
|
— |
|
Repayments on financing lease obligations |
|
|
(251 |
) |
|
|
(237 |
) |
Issuance of common stock |
|
|
458 |
|
|
|
334 |
|
Tax withholdings related to net share settlements of restricted stock units and awards |
|
|
(1,532 |
) |
|
|
(854 |
) |
Net cash used by financing activities |
|
|
(1,325 |
) |
|
|
(757 |
) |
Effect of exchange rate changes on cash |
|
|
141 |
|
|
|
(39 |
) |
Net increase in cash and cash equivalents |
|
|
677 |
|
|
|
13,107 |
|
Cash and cash equivalents at beginning of period |
|
|
21,577 |
|
|
|
16,939 |
|
Cash and cash equivalents at end of period |
|
$ |
22,254 |
|
|
$ |
30,046 |
|
See Notes to Condensed Consolidated Financial Statements.
GRAHAM CORPORATION AND SUBSIDIARIES
CONDENSED CONSOLIDATED STATEMENTS OF CHANGES IN STOCKHOLDERS’ EQUITY
(Dollar amounts in thousands)
(Unaudited)
|
|
|
|
|
|
|
|
|
|
|
|
|
|
|
|
|
|
|
|
|
|
|
|
|
|
|
|
|
|
|
Common Stock |
|
|
Capital in |
|
|
|
|
|
Accumulated
Other |
|
|
|
|
|
Total |
|
|
|
|
|
|
Par |
|
|
Excess of |
|
|
Retained |
|
|
Comprehensive |
|
|
Treasury |
|
|
Stockholders' |
|
|
|
Shares |
|
|
Value |
|
|
Par Value |
|
|
Earnings |
|
|
Loss |
|
|
Stock |
|
|
Equity |
|
Balance at April 1, 2025 |
|
|
11,077 |
|
|
$ |
1,107 |
|
|
$ |
34,616 |
|
|
$ |
94,229 |
|
|
$ |
(6,987 |
) |
|
$ |
(3,388 |
) |
|
$ |
119,577 |
|
Comprehensive income |
|
|
|
|
|
|
|
|
|
|
|
4,595 |
|
|
|
212 |
|
|
|
|
|
|
4,807 |
|
Stock awards vested |
|
|
73 |
|
|
|
7 |
|
|
|
(1,539 |
) |
|
|
|
|
|
|
|
|
|
|
|
(1,532 |
) |
Recognition of equity-based
compensation expense |
|
|
|
|
|
|
|
|
532 |
|
|
|
|
|
|
|
|
|
|
|
|
532 |
|
Balance at June 30, 2025 |
|
|
11,150 |
|
|
$ |
1,114 |
|
|
$ |
33,609 |
|
|
$ |
98,824 |
|
|
$ |
(6,775 |
) |
|
$ |
(3,388 |
) |
|
$ |
123,384 |
|
Comprehensive income |
|
|
|
|
|
|
|
|
|
|
|
3,090 |
|
|
|
105 |
|
|
|
|
|
|
3,195 |
|
Issuance of shares |
|
|
12 |
|
|
|
2 |
|
|
|
456 |
|
|
|
|
|
|
|
|
|
|
|
|
458 |
|
Recognition of equity-based
compensation expense |
|
|
|
|
|
|
|
|
553 |
|
|
|
|
|
|
|
|
|
|
|
|
553 |
|
Balance at September 30, 2025 |
|
|
11,162 |
|
|
$ |
1,116 |
|
|
$ |
34,618 |
|
|
$ |
101,914 |
|
|
$ |
(6,670 |
) |
|
$ |
(3,388 |
) |
|
$ |
127,590 |
|
Comprehensive income |
|
|
|
|
|
|
|
|
|
|
|
2,845 |
|
|
|
233 |
|
|
|
|
|
|
3,078 |
|
Recognition of equity-based
compensation expense |
|
|
|
|
|
|
|
|
642 |
|
|
|
|
|
|
|
|
|
|
|
|
642 |
|
Balance at December 31, 2025 |
|
|
11,162 |
|
|
$ |
1,116 |
|
|
$ |
35,260 |
|
|
$ |
104,759 |
|
|
$ |
(6,437 |
) |
|
$ |
(3,388 |
) |
|
$ |
131,310 |
|
|
|
|
|
|
|
|
|
|
|
|
|
|
|
|
|
|
|
|
|
|
|
|
|
|
|
|
|
|
|
|
|
|
|
|
|
|
|
|
|
|
|
|
|
|
|
|
|
|
|
|
|
|
Common Stock |
|
|
Capital in |
|
|
|
|
|
Accumulated
Other |
|
|
|
|
|
Total |
|
|
|
|
|
|
Par |
|
|
Excess of |
|
|
Retained |
|
|
Comprehensive |
|
|
Treasury |
|
|
Stockholders' |
|
|
|
Shares |
|
|
Value |
|
|
Par Value |
|
|
Earnings |
|
|
Loss |
|
|
Stock |
|
|
Equity |
|
Balance at April 1, 2024 |
|
|
10,993 |
|
|
$ |
1,099 |
|
|
$ |
32,015 |
|
|
$ |
81,999 |
|
|
$ |
(7,013 |
) |
|
$ |
(2,534 |
) |
|
$ |
105,566 |
|
Comprehensive income |
|
|
|
|
|
|
|
|
|
|
|
2,966 |
|
|
|
122 |
|
|
|
|
|
|
3,088 |
|
Stock awards vested |
|
|
50 |
|
|
|
5 |
|
|
|
(5 |
) |
|
|
|
|
|
|
|
|
|
|
|
— |
|
Recognition of equity-based
compensation expense |
|
|
|
|
|
|
|
|
344 |
|
|
|
|
|
|
|
|
|
|
|
|
344 |
|
Tax withholdings related to settlements of restricted stock |
|
|
|
|
|
|
|
|
|
|
|
|
|
|
|
|
|
(810 |
) |
|
|
(810 |
) |
Balance at June 30, 2024 |
|
|
11,043 |
|
|
$ |
1,104 |
|
|
$ |
32,354 |
|
|
$ |
84,965 |
|
|
$ |
(6,891 |
) |
|
$ |
(3,344 |
) |
|
$ |
108,188 |
|
Comprehensive income |
|
|
|
|
|
|
|
|
|
|
|
3,281 |
|
|
|
281 |
|
|
|
|
|
|
3,562 |
|
Issuance of shares |
|
|
21 |
|
|
|
2 |
|
|
|
332 |
|
|
|
|
|
|
|
|
|
|
|
|
334 |
|
Recognition of equity-based
compensation expense |
|
|
|
|
|
|
|
|
434 |
|
|
|
|
|
|
|
|
|
|
|
|
434 |
|
Tax withholdings related to settlements of restricted stock |
|
|
|
|
|
|
|
|
|
|
|
|
|
|
|
|
|
(44 |
) |
|
|
(44 |
) |
Balance at September 30, 2024 |
|
|
11,064 |
|
|
$ |
1,106 |
|
|
$ |
33,120 |
|
|
$ |
88,246 |
|
|
$ |
(6,610 |
) |
|
$ |
(3,388 |
) |
|
$ |
112,474 |
|
Comprehensive income (loss) |
|
|
|
|
|
|
|
|
|
|
|
1,588 |
|
|
|
(57 |
) |
|
|
|
|
|
1,531 |
|
Recognition of equity-based
compensation expense |
|
|
|
|
|
|
|
|
426 |
|
|
|
|
|
|
|
|
|
|
|
|
426 |
|
Balance at December 31, 2024 |
|
|
11,064 |
|
|
$ |
1,106 |
|
|
$ |
33,546 |
|
|
$ |
89,834 |
|
|
$ |
(6,667 |
) |
|
$ |
(3,388 |
) |
|
$ |
114,431 |
|
See Notes to Condensed Consolidated Financial Statements.
GRAHAM CORPORATION AND SUBSIDIARIES
NOTES TO CONDENSED CONSOLIDATED FINANCIAL STATEMENTS
(Amounts in thousands, except per share data)
(Unaudited)
NOTE 1 – BASIS OF PRESENTATION:
Graham Corporation's (the "Company's") Condensed Consolidated Financial Statements include its wholly-owned subsidiaries located in Arvada, CO, Jupiter, FL, Suzhou, China and Ahmedabad and Pune, India at December 31 and March 31, 2025. The Condensed Consolidated Financial Statements have been prepared in accordance with accounting principles generally accepted in the U.S. ("GAAP") for interim financial information and the instructions to Form 10-Q and Rule 10-01 of Regulation S-X, each as promulgated by the U.S. Securities and Exchange Commission. The Company's Condensed Consolidated Financial Statements do not include all information and notes required by GAAP for complete financial statements. The unaudited Condensed Consolidated Balance Sheet as of March 31, 2025 presented herein was derived from the Company’s audited Consolidated Balance Sheet as of March 31, 2025. For additional information, please refer to the consolidated financial statements and notes included in the Company's Annual Report on Form 10-K for the fiscal year ended March 31, 2025 ("fiscal 2025"). In the opinion of management, all adjustments, including normal recurring accruals considered necessary for a fair presentation, have been included in the Company's Condensed Consolidated Financial Statements.
The Company's results of operations and cash flows for the three and nine months ended December 31, 2025 are not necessarily indicative of the results that may be expected for the current fiscal year, which ends March 31, 2026 ("fiscal 2026").
NOTE 2 – ACQUISITION:
On October 20, 2025, the Company completed its acquisition of Xdot Bearing Technologies ("Xdot"), a specialized consulting, design, and engineering firm focused on foil bearing technology. Xdot will be integrated into the Barber-Nichols ("BN") business. The purchase price of this transaction was $900, subject to certain potential adjustments including a customary working capital adjustment, and was funded with cash on hand. The purchase agreement included two potential cash contingent earn-outs to be paid on the first and second anniversary of the transaction dependent upon the achievement of certain qualitative milestones totaling $600. As of December 31, 2025, a $514 contingent earn-out liability was recorded. The Company preliminarily recorded goodwill in the amount of $661, as well as an intangible asset for technology and technical know-how in the amount of $650, which will be amortized over 10 years and is deductible for tax purposes. The sales and results of Xdot were immaterial to fiscal 2026. Acquisition related costs were $539 and $643 for the three and nine months ended December 31, 2025 in connection with the Company's acquisitions.
See Note 16 "Subsequent Events" for additional information regarding the Company's acquisition activity.
NOTE 3 – REVENUE RECOGNITION:
The Company recognizes revenue on contracts when or as it satisfies a performance obligation by transferring control of the product to the customer. For contracts in which revenue is recognized upon shipment, control is generally transferred when products are shipped, title is transferred, significant risks of ownership have transferred, the Company has rights to payment, and rewards of ownership pass to the customer. For contracts in which revenue is recognized over time, control is generally transferred as the Company creates an asset that does not have an alternative use to the Company and the Company has an enforceable right to payment for the performance completed to date.
The following table presents the Company’s revenue disaggregated by product line and geographic area:
|
|
|
|
|
|
|
|
|
|
|
|
|
|
|
|
|
|
|
Three Months Ended |
|
|
Nine Months Ended |
|
|
|
December 31, |
|
|
December 31, |
|
Market |
|
2025 |
|
|
2024 |
|
|
2025 |
|
|
2024 |
|
Defense |
|
$ |
35,283 |
|
|
$ |
27,023 |
|
|
$ |
105,568 |
|
|
$ |
87,014 |
|
Energy & Process |
|
|
18,287 |
|
|
|
16,193 |
|
|
|
62,139 |
|
|
|
52,353 |
|
Space |
|
|
3,131 |
|
|
|
3,821 |
|
|
|
10,508 |
|
|
|
11,184 |
|
Net sales |
|
$ |
56,701 |
|
|
$ |
47,037 |
|
|
$ |
178,215 |
|
|
$ |
150,551 |
|
|
|
|
|
|
|
|
|
|
|
|
|
|
|
|
|
|
|
|
|
|
|
|
|
|
|
Geographic Region |
|
|
|
|
|
|
|
|
|
|
|
|
Asia |
|
$ |
3,425 |
|
|
$ |
2,275 |
|
|
$ |
11,160 |
|
|
$ |
11,851 |
|
Canada |
|
|
2,744 |
|
|
|
2,441 |
|
|
|
9,871 |
|
|
|
5,102 |
|
Middle East |
|
|
1,402 |
|
|
|
1,551 |
|
|
|
4,518 |
|
|
|
3,328 |
|
South America |
|
|
141 |
|
|
|
495 |
|
|
|
592 |
|
|
|
864 |
|
U.S. |
|
|
48,112 |
|
|
|
39,675 |
|
|
|
149,532 |
|
|
|
126,065 |
|
All other |
|
|
877 |
|
|
|
600 |
|
|
|
2,542 |
|
|
|
3,341 |
|
Net sales |
|
$ |
56,701 |
|
|
$ |
47,037 |
|
|
$ |
178,215 |
|
|
$ |
150,551 |
|
A performance obligation represents a promise in a contract to provide a distinct good or service to a customer. The Company accounts for a contract when it has approval and commitment from both parties, the rights of the parties are identified, payment terms are identified, the contract has commercial substance and collectability of consideration is probable. Transaction price reflects the amount of consideration to which the Company expects to be entitled in exchange for transferred products. A contract’s transaction price is allocated to each distinct performance obligation and revenue is recognized when or as the performance obligation is satisfied. In certain cases, the Company may separate a contract into more than one performance obligation, while in other cases, several products may be part of a fully integrated solution and are bundled into a single performance obligation. If a contract is separated into more than one performance obligation, the Company allocates the total transaction price to each performance obligation in an amount based on the estimated relative standalone selling prices of the promised goods underlying each performance obligation. The Company has made an accounting policy election to exclude from the measurement of the contract price all taxes assessed by government authorities that are collected by the Company from its customers. The Company does not adjust the contract price for the effects of a financing component if the Company expects, at contract inception, that the period between when a product is transferred to a customer and when the customer pays for the product will be one year or less. Shipping and handling fees billed to the customer are recorded in revenue and the related costs incurred for shipping and handling are included in cost of products sold.
The Company recognizes revenue over time when contract performance results in the creation of a product for which the Company does not have an alternative use and the contract includes an enforceable right to payment in an amount that corresponds directly with the value of the performance completed. To measure progress towards completion on performance obligations for which revenue is recognized over time the Company utilizes an input method based upon a ratio of direct labor hours incurred to date to management’s estimate of the total labor hours to be incurred on each contract, an input method based upon a ratio of total contract costs incurred to date to management’s estimate of the total contract costs to be incurred or an output method based upon completion of operational milestones, depending upon the nature of the contract. The Company has established the systems and procedures essential to developing the estimates required to account for performance obligations over time. These procedures include monthly review by management of costs incurred, progress towards completion, identified risks and opportunities, sourcing determinations, changes in estimates of costs yet to be incurred, availability of materials, and execution by subcontractors. Sales and earnings are adjusted in current accounting periods based on revisions in the contract value due to pricing changes and estimated costs at completion. Losses on contracts are recognized immediately when evident to management. Revenue on the majority of the Company's contracts, as measured by number of contracts, is recognized upon shipment to the customer. Revenue on larger contracts, which are fewer in number but represent the majority of revenue, is recognized over time. The following table presents the Company's revenue percentages disaggregated by revenue recognized over time or upon shipment:
|
|
|
|
|
|
|
|
|
|
|
|
|
|
|
|
|
|
|
Three Months Ended |
|
|
Nine Months Ended |
|
|
|
December 31, |
|
|
December 31, |
|
|
|
2025 |
|
|
2024 |
|
|
2025 |
|
|
2024 |
|
|
|
|
|
|
|
|
|
|
|
|
|
|
Revenue recognized over time |
|
|
79 |
% |
|
|
75 |
% |
|
|
81 |
% |
|
|
79 |
% |
Revenue recognized at shipment |
|
|
21 |
% |
|
|
25 |
% |
|
|
19 |
% |
|
|
21 |
% |
The timing of revenue recognition, invoicing and cash collections affect trade accounts receivable, unbilled revenue (contract assets) and customer deposits (contract liabilities) on the Condensed Consolidated Balance Sheets. Unbilled revenue represents revenue
on contracts that is recognized over time and exceeds the amount that has been billed to the customer. Unbilled revenue is separately presented in the Condensed Consolidated Balance Sheets. The Company may have an unconditional right to payment upon billing and prior to satisfying the performance obligations. The Company will then record a contract liability and an offsetting asset of equal amount until the deposit is collected and the performance obligations are satisfied. Customer deposits are separately presented in the Condensed Consolidated Balance Sheets. Customer deposits are not considered a significant financing component as they are generally received less than one year before the product is completed or used to procure specific material on a contract, as well as related overhead costs incurred during design and construction.
Net contract assets (liabilities) consisted of the following:
|
|
|
|
|
|
|
|
|
|
|
|
|
|
|
|
|
|
|
|
|
|
|
|
December 31, 2025 |
|
|
March 31, 2025 |
|
|
Change |
|
|
|
Change due to revenue recognized |
|
|
Change due to invoicing customers/
additional deposits |
|
|
|
|
|
|
|
|
|
|
|
|
|
|
|
|
|
|
Unbilled revenue - contract assets |
|
$ |
57,823 |
|
|
$ |
38,494 |
|
|
$ |
19,329 |
|
|
|
$ |
93,028 |
|
|
$ |
(73,699 |
) |
Customer deposits - contract liabilities |
|
|
(111,984 |
) |
|
|
(84,062 |
) |
|
|
(27,922 |
) |
|
|
|
58,165 |
|
|
|
(86,087 |
) |
Net contract (liabilities) assets |
|
$ |
(54,161 |
) |
|
$ |
(45,568 |
) |
|
$ |
(8,593 |
) |
|
|
|
|
|
|
|
Contract liabilities at December 31, and March 31, 2025 include $7,506 and $12,315, respectively, of customer deposits for which the Company has an unconditional right to collect payment. Trade accounts receivable, as presented on the Condensed Consolidated Balance Sheets, includes corresponding balances at December 31, and March 31, 2025, respectively.
Receivables billed but not paid under retainage provisions in the Company’s customer contracts were $2,506 and $1,999 at December 31, and March 31, 2025, respectively.
The Company’s remaining unsatisfied performance obligations represent a measure of the total dollar value of work to be performed on contracts awarded and in progress. The Company also refers to this measure as backlog. As of December 31, 2025, the Company had remaining unsatisfied performance obligations of $515,633. The Company expects to recognize revenue on approximately 35% to 40% of the remaining performance obligations within one year, 25% to 30% in one to two years and the remaining beyond two years.
NOTE 4 – INVENTORIES:
Inventories are stated at the lower of cost or net realizable value, using the average cost method. Major classifications of inventories are as follows:
|
|
|
|
|
|
|
|
|
|
|
December 31, |
|
|
March 31, |
|
|
|
2025 |
|
|
2025 |
|
Raw materials and supplies |
|
$ |
5,818 |
|
|
$ |
5,859 |
|
Work in process |
|
|
40,147 |
|
|
|
32,579 |
|
Finished products |
|
|
2,558 |
|
|
|
1,587 |
|
Total |
|
$ |
48,523 |
|
|
$ |
40,025 |
|
NOTE 5 – INTANGIBLE ASSETS:
Intangible assets are comprised of the following:
|
|
|
|
|
|
|
|
|
|
|
|
|
|
|
Weighted Average Amortization Period |
|
Gross Carrying Amount |
|
|
Accumulated Amortization |
|
|
Net Carrying Amount |
|
At December 31, 2025 |
|
|
|
|
|
|
|
|
|
|
Intangibles subject to amortization: |
|
|
|
|
|
|
|
|
|
|
Customer relationships |
8 - 20 years |
|
$ |
16,200 |
|
|
$ |
3,896 |
|
|
$ |
12,304 |
|
Technology and technical know-how |
10 - 20 years |
|
|
13,250 |
|
|
|
2,867 |
|
|
|
10,383 |
|
Tradename |
3 years |
|
|
300 |
|
|
|
217 |
|
|
|
83 |
|
|
|
|
$ |
29,750 |
|
|
$ |
6,980 |
|
|
$ |
22,770 |
|
|
|
|
|
|
|
|
|
|
|
|
Intangibles not subject to amortization: |
|
|
|
|
|
|
|
|
|
|
Goodwill |
Indefinite |
|
$ |
26,181 |
|
|
$ |
— |
|
|
$ |
26,181 |
|
Tradename |
Indefinite |
|
|
6,700 |
|
|
|
— |
|
|
|
6,700 |
|
|
|
|
$ |
32,881 |
|
|
$ |
— |
|
|
$ |
32,881 |
|
|
|
|
|
|
|
|
|
|
|
|
|
|
|
|
Weighted Average Amortization Period |
|
Gross Carrying Amount |
|
|
Accumulated Amortization |
|
|
Net Carrying Amount |
|
At March 31, 2025 |
|
|
|
|
|
|
|
|
|
|
Intangibles subject to amortization: |
|
|
|
|
|
|
|
|
|
|
Customer relationships |
8 - 20 years |
|
$ |
16,200 |
|
|
$ |
3,041 |
|
|
$ |
13,159 |
|
Technology and technical know-how |
10 - 20 years |
|
|
12,600 |
|
|
|
2,290 |
|
|
|
10,310 |
|
Backlog |
4 years |
|
|
3,900 |
|
|
|
3,900 |
|
|
|
— |
|
Tradename |
3 years |
|
|
300 |
|
|
|
142 |
|
|
|
158 |
|
|
|
|
$ |
33,000 |
|
|
$ |
9,373 |
|
|
$ |
23,627 |
|
|
|
|
|
|
|
|
|
|
|
|
Intangibles not subject to amortization: |
|
|
|
|
|
|
|
|
|
|
Goodwill |
Indefinite |
|
$ |
25,520 |
|
|
$ |
— |
|
|
$ |
25,520 |
|
Tradename |
Indefinite |
|
|
6,700 |
|
|
|
— |
|
|
|
6,700 |
|
|
|
|
$ |
32,220 |
|
|
$ |
— |
|
|
$ |
32,220 |
|
Intangible amortization was $510 and $554 for the three months ended December 31, 2025 and 2024, respectively, and $1,507 and $1,663 for the nine months ended December 31, 2025 and 2024, respectively. The estimated annual future amortization expense by fiscal year is as follows:
|
|
|
|
|
|
|
Annual Amortization |
|
Remainder of 2026 |
|
$ |
515 |
|
2027 |
|
|
2,018 |
|
2028 |
|
|
1,960 |
|
2029 |
|
|
1,960 |
|
2030 |
|
|
1,960 |
|
2031 and thereafter |
|
|
14,357 |
|
Total intangible amortization |
|
$ |
22,770 |
|
|
|
|
|
NOTE 6 – EQUITY-BASED COMPENSATION:
The 2020 Graham Corporation Equity Incentive Plan, as amended (the "2020 Plan"), provides for the issuance of 722 shares of common stock in connection with grants of incentive stock options, non-qualified stock options, restricted stock units and stock awards to officers, key employees and outside directors, including 112 shares that became available under the 2020 Plan from the Company’s prior plan, the Amended and Restated 2000 Graham Corporation Incentive Plan to Increase Shareholder Value (the "2000 Plan"). As of August 11, 2020, the effective date of the 2020 Plan, no further awards will be granted under the 2000 Plan.
Five time vesting restricted stock units ("RSUs") and no performance based restricted stock units ("PSUs") were awarded in the three months ended December 31, 2025. No RSUs or PSUs were awarded in the three months ended December 31, 2024. The following restricted stock units were awarded in the nine months ended December 31, 2025 and 2024:
|
|
|
|
|
|
|
|
|
|
|
|
|
|
|
|
|
Vest 100% on First |
|
|
Vest One-Third Per Year |
|
|
Vest 100% on Third |
|
|
|
|
|
Anniversary (1) |
|
|
Over Three-Year Term (1) |
|
|
Anniversary (1) |
|
|
|
|
|
|
|
|
Officers and |
|
|
Officers and |
|
|
Total Shares |
Nine months ended December 31, |
|
Directors |
|
|
Key Employees |
|
|
Key Employees |
|
|
Awarded |
2025 |
|
|
|
|
|
|
|
|
|
|
|
Time Vesting RSUs |
|
11 |
|
|
22 |
|
|
|
— |
|
|
33 |
Performance Vesting PSUs |
|
|
— |
|
|
|
— |
|
|
42 |
|
|
42 |
2024 |
|
|
|
|
|
|
|
|
|
|
|
Time Vesting RSUs |
|
18 |
|
|
29 |
|
|
8 |
|
|
55 |
Performance Vesting PSUs |
|
|
— |
|
|
|
— |
|
|
62 |
|
|
62 |
(1)Subject to the terms of the applicable award.
The Company has an Employee Stock Purchase Plan, as amended (the "ESPP"), which allows eligible employees to purchase shares of the Company's common stock at a discount of up to 15% of its fair market value on the lower of the last or first day of the six-month offering period. As of December 31, 2025, a total of 88 shares of common stock remain available to be purchased under the ESPP.
The Company has recognized equity-based compensation costs, which is primarily included in selling, general and administrative costs, as follows:
|
|
|
|
|
|
|
|
|
|
|
|
|
|
|
|
|
|
|
Three Months Ended |
|
|
Nine Months Ended |
|
|
|
December 31, |
|
|
December 31, |
|
|
|
2025 |
|
|
2024 |
|
|
2025 |
|
|
2024 |
|
Restricted stock awards |
|
$ |
— |
|
|
$ |
— |
|
|
$ |
— |
|
|
$ |
33 |
|
Restricted stock units |
|
|
599 |
|
|
|
392 |
|
|
|
1,605 |
|
|
|
1,074 |
|
Employee stock purchase plan |
|
|
43 |
|
|
|
34 |
|
|
|
122 |
|
|
|
97 |
|
|
|
$ |
642 |
|
|
$ |
426 |
|
|
$ |
1,727 |
|
|
$ |
1,204 |
|
|
|
|
|
|
|
|
|
|
|
|
|
|
Income tax benefit recognized |
|
$ |
148 |
|
|
$ |
98 |
|
|
$ |
396 |
|
|
$ |
277 |
|
NOTE 7 – INCOME PER SHARE:
Basic income per share is computed by dividing net income by the weighted average number of common shares outstanding for the period. Diluted income per share is calculated by dividing net income by the weighted average number of common shares outstanding
and, when applicable, potential common shares outstanding during the period. A reconciliation of the numerators and denominators of basic and diluted income per share is presented below:
|
|
|
|
|
|
|
|
|
|
|
|
|
|
|
|
|
|
|
Three Months Ended |
|
|
Nine Months Ended |
|
|
|
December 31, |
|
|
December 31, |
|
|
|
2025 |
|
|
2024 |
|
|
2025 |
|
|
2024 |
|
Basic income per share |
|
|
|
|
|
|
|
|
|
|
|
|
Numerator: |
|
|
|
|
|
|
|
|
|
|
|
|
Net income |
|
$ |
2,845 |
|
|
$ |
1,588 |
|
|
$ |
10,530 |
|
|
$ |
7,835 |
|
Denominator: |
|
|
|
|
|
|
|
|
|
|
|
|
Weighted average common shares
outstanding |
|
|
10,988 |
|
|
|
10,890 |
|
|
|
10,967 |
|
|
|
10,880 |
|
Basic income per share |
|
$ |
0.26 |
|
|
$ |
0.15 |
|
|
$ |
0.96 |
|
|
$ |
0.72 |
|
|
|
|
|
|
|
|
|
|
|
|
|
|
Diluted income per share |
|
|
|
|
|
|
|
|
|
|
|
|
Numerator: |
|
|
|
|
|
|
|
|
|
|
|
|
Net income |
|
$ |
2,845 |
|
|
$ |
1,588 |
|
|
$ |
10,530 |
|
|
$ |
7,835 |
|
Denominator: |
|
|
|
|
|
|
|
|
|
|
|
|
Weighted average common shares
outstanding |
|
|
10,988 |
|
|
|
10,890 |
|
|
|
10,967 |
|
|
|
10,880 |
|
Restricted stock units outstanding |
|
|
169 |
|
|
|
167 |
|
|
|
141 |
|
|
|
136 |
|
Weighted average common and
potential common shares
outstanding |
|
|
11,157 |
|
|
|
11,057 |
|
|
|
11,108 |
|
|
|
11,016 |
|
Diluted income per share |
|
$ |
0.25 |
|
|
$ |
0.14 |
|
|
$ |
0.95 |
|
|
$ |
0.71 |
|
NOTE 8 – PRODUCT WARRANTY LIABILITY:
The reconciliation of the changes in the product warranty liability is as follows:
|
|
|
|
|
|
|
|
|
|
|
|
|
|
|
|
|
|
|
Three Months Ended |
|
|
Nine Months Ended |
|
|
|
December 31, |
|
|
December 31, |
|
|
|
2025 |
|
|
2024 |
|
|
2025 |
|
|
2024 |
|
Balance at beginning of period |
|
$ |
737 |
|
|
$ |
637 |
|
|
$ |
786 |
|
|
$ |
806 |
|
Expense for product warranties |
|
|
144 |
|
|
|
151 |
|
|
|
162 |
|
|
|
199 |
|
Product warranty claims paid |
|
|
(18 |
) |
|
|
(27 |
) |
|
|
(85 |
) |
|
|
(244 |
) |
Balance at end of period |
|
$ |
863 |
|
|
$ |
761 |
|
|
$ |
863 |
|
|
$ |
761 |
|
The product warranty liability is included in the line item accrued expenses and other current liabilities in the Condensed Consolidated Balance Sheets.
NOTE 9 – CASH FLOW STATEMENT:
Interest and income taxes paid as well as non-cash investing and financing activities are as follows:
|
|
|
|
|
|
|
|
|
|
|
For the Nine Months Ended |
|
|
|
December 31, |
|
|
|
2025 |
|
|
2024 |
|
Interest paid |
|
$ |
183 |
|
|
$ |
243 |
|
Income taxes paid |
|
|
117 |
|
|
|
2,826 |
|
Capital purchases recorded in accounts payable |
|
|
855 |
|
|
|
1,587 |
|
NOTE 10 – COMMITMENTS AND CONTINGENCIES:
The Company has been named as a defendant in lawsuits alleging personal injury from exposure to asbestos allegedly contained in, or accompanying, products made by the Company or from exposure to asbestos at the Company's facilities. The Company is a co-defendant with numerous other defendants in these lawsuits and intends to vigorously defend itself against these claims. The claims in most of the Company’s current lawsuits are similar to those made in previous asbestos-related suits that named the Company as a defendant, which either were dismissed when it was shown that the Company had not supplied products to the plaintiffs’ places of work
or were settled for immaterial amounts. The Company believes that the resolution of these asbestos-related lawsuits will not have a material adverse effect on the Company's financial position or results of operations. However, legal matters are subject to inherent uncertainties and there exists the possibility that the ultimate resolution of these asbestos-related lawsuits could have a material adverse impact on the Company's financial position and the results of operations.
During the third quarter of fiscal 2024, the Audit Committee of the Board of Directors, with the assistance of external counsel and forensic professionals, concluded an investigation into a whistleblower complaint received regarding its wholly-owned subsidiary Graham India Private Limited ("GIPL"). The investigation identified evidence supporting the complaint and other misconduct by employees. The other misconduct was over a period of four years, was not deemed to be material, and was isolated to a few employees. All involved employees have been terminated or are no longer with the Company and the Company has implemented remedial actions, including strengthening its compliance program and internal controls. As a result of the investigation, during the third quarter of fiscal 2024, the statutory auditor and bookkeeper of GIPL tendered their resignations and new firms were appointed. The Company has voluntarily reported the findings of its investigation to the appropriate authorities in India, the U.S. Department of Justice, and the Securities and Exchange Commission and will continue to cooperate with those authorities. Although the resolutions of these matters are inherently uncertain, we do not believe any remaining impact will be material to the Company’s overall consolidated results of operations, financial position, or cash flows.
As of December 31, 2025, the Company was subject to the claims noted above, as well as other potential claims that have arisen in the ordinary course of business. Although the outcome of the lawsuits, legal proceedings or potential claims to which the Company is, or may become, a party to cannot be determined and an estimate of the reasonably possible loss or range of loss cannot be made for the majority of the claims, management does not believe that the outcomes, either individually or in the aggregate, will have a material adverse effect on the Company’s results of operations, financial position or cash flows.
The Company has entered into operating leases with companies in which our Executive Chairman holds a majority interest for buildings, equipment, and storage units located in Arvada, Colorado. In connection with such leases and rental agreements, the Company made fixed minimum lease payments to the lessor of $256 and $248 during the three months ended December 31, 2025 and 2024, respectively, and $762 and $742 during the nine months ended December 31, 2025 and 2024, respectively. The Company is obligated to make payments of $256 during the remainder of fiscal 2026. Future fixed minimum lease payments under these leases as of December 31, 2025 are $4,039.
NOTE 11 – INCOME TAXES:
The Company files federal and state income tax returns in several domestic and international jurisdictions. In most tax jurisdictions, returns are subject to examination by the relevant tax authorities for a number of years after the returns have been filed. The Company is subject to U.S. federal examination for the tax years 2021 through 2024 and examination in state tax jurisdictions for the tax years 2020 through 2024. The Company is subject to examination in the People’s Republic of China for tax years 2021 through 2024 and in India for tax years 2021 through 2024.
There was no liability for unrecognized tax benefits at either December 31, 2025 or March 31, 2025.
The income tax provision for interim periods is determined using an estimate of the annual effective tax rate, adjusted for discrete items, if any, that are taken into account in the relevant period. Each quarter, the estimate of the annual effective tax rate is updated, and if the estimated effective tax rate changes, a cumulative adjustment is made. There is a potential for volatility of the effective tax rate due to several factors, including discrete items, changes in the mix and amount of projected pre-tax income and the jurisdictions to which it relates, changes in tax laws and foreign tax holidays, business reorganizations, settlements with taxing authorities and foreign currency fluctuations. In addition, the Company continues to explore tax planning opportunities that may have a material impact on its effective tax rate.
The Company's effective tax rate for the third quarter of fiscal 2026 was 11%, compared with 29% in the third quarter of fiscal 2025. The effective tax rate for the first nine months of fiscal 2026 was 15%, compared with 20% for the first nine months of fiscal 2025. The decrease in our effective tax rate for the third quarter of fiscal 2026 was primarily due to higher than expected research and development tax credits. The decrease in our effective tax rate for the nine month period of fiscal 2026 was primarily due to a higher discrete tax benefit recognized in the first quarter of fiscal 2026 related to the vesting of restricted stock awards and the Company's improved stock price over the last year and the higher than expected research and development tax credits recognized in the third quarter of fiscal 2026, partially offset by the impact of the enactment of the One Big Beautiful Bill Act ("OBBB") on July 4, 2025.
NOTE 12 – CHANGES IN ACCUMULATED OTHER COMPREHENSIVE LOSS:
The changes in accumulated other comprehensive loss by component for the three and nine months ended December 31, 2025 and 2024 are as follows:
|
|
|
|
|
|
|
|
|
|
|
|
|
|
|
Pension and
Other
Postretirement
Benefit Items |
|
|
Foreign
Currency
Items |
|
|
Total |
|
Balance at April 1, 2025 |
|
$ |
(6,671 |
) |
|
$ |
(316 |
) |
|
$ |
(6,987 |
) |
Other comprehensive income before reclassifications |
|
|
— |
|
|
|
50 |
|
|
|
50 |
|
Amounts reclassified from accumulated other comprehensive loss |
|
|
162 |
|
|
|
— |
|
|
|
162 |
|
Net current-period other comprehensive income |
|
|
162 |
|
|
|
50 |
|
|
|
212 |
|
Balance at June 30, 2025 |
|
|
(6,509 |
) |
|
|
(266 |
) |
|
|
(6,775 |
) |
Other comprehensive loss before reclassifications |
|
|
— |
|
|
|
(56 |
) |
|
|
(56 |
) |
Amounts reclassified from accumulated other comprehensive loss |
|
|
161 |
|
|
|
— |
|
|
|
161 |
|
Net current-period other comprehensive income (loss) |
|
|
161 |
|
|
|
(56 |
) |
|
|
105 |
|
Balance at September 30, 2025 |
|
|
(6,348 |
) |
|
|
(322 |
) |
|
|
(6,670 |
) |
Other comprehensive income before reclassifications |
|
|
— |
|
|
|
72 |
|
|
|
72 |
|
Amounts reclassified from accumulated other comprehensive loss |
|
|
161 |
|
|
|
— |
|
|
|
161 |
|
Net current-period other comprehensive income |
|
|
161 |
|
|
|
72 |
|
|
|
233 |
|
Balance at December 31, 2025 |
|
$ |
(6,187 |
) |
|
$ |
(250 |
) |
|
$ |
(6,437 |
) |
|
|
|
|
|
|
|
|
|
|
|
|
|
|
|
Pension and
Other
Postretirement
Benefit Items |
|
|
Foreign
Currency
Items |
|
|
Total |
|
Balance at April 1, 2024 |
|
$ |
(6,776 |
) |
|
$ |
(237 |
) |
|
$ |
(7,013 |
) |
Other comprehensive loss before reclassifications |
|
|
— |
|
|
|
(28 |
) |
|
|
(28 |
) |
Amounts reclassified from accumulated other comprehensive loss |
|
|
150 |
|
|
|
— |
|
|
|
150 |
|
Net current-period other comprehensive income (loss) |
|
|
150 |
|
|
|
(28 |
) |
|
|
122 |
|
Balance at June 30, 2024 |
|
|
(6,626 |
) |
|
|
(265 |
) |
|
|
(6,891 |
) |
Other comprehensive income before reclassifications |
|
|
— |
|
|
|
131 |
|
|
|
131 |
|
Amounts reclassified from accumulated other comprehensive loss |
|
|
150 |
|
|
|
— |
|
|
|
150 |
|
Net current-period other comprehensive income |
|
|
150 |
|
|
|
131 |
|
|
|
281 |
|
Balance at September 30, 2024 |
|
|
(6,476 |
) |
|
|
(134 |
) |
|
|
(6,610 |
) |
Other comprehensive loss before reclassifications |
|
|
— |
|
|
|
(208 |
) |
|
|
(208 |
) |
Amounts reclassified from accumulated other comprehensive loss |
|
|
151 |
|
|
|
— |
|
|
|
151 |
|
Net current-period other comprehensive income (loss) |
|
|
151 |
|
|
|
(208 |
) |
|
|
(57 |
) |
Balance at December 31, 2024 |
|
$ |
(6,325 |
) |
|
$ |
(342 |
) |
|
$ |
(6,667 |
) |
The reclassifications out of accumulated other comprehensive loss by component for the three and nine months ended December 31, 2025 and 2024 are as follows:
|
|
|
|
|
|
|
|
|
|
|
|
|
Details about Accumulated Other
Comprehensive Loss Components |
|
Amount Reclassified from
Accumulated Other
Comprehensive Loss |
|
|
|
Affected Line Item in the Condensed
Consolidated Statements of Income |
|
|
Three Months Ended |
|
|
|
|
|
|
December 31, |
|
|
|
|
|
|
2025 |
|
|
|
2024 |
|
|
|
|
Pension and other postretirement benefit items: |
|
|
|
|
|
|
|
|
|
|
Amortization of actuarial loss |
|
$ |
210 |
|
(1) |
|
$ |
196 |
|
(1) |
|
Income before provision for income taxes |
Tax effect |
|
|
49 |
|
|
|
|
45 |
|
|
|
Provision for income taxes |
|
|
$ |
161 |
|
|
|
$ |
151 |
|
|
|
Net income |
|
|
|
|
|
|
|
|
|
|
|
|
|
Details about Accumulated Other
Comprehensive Loss Components |
|
Amount Reclassified from
Accumulated Other
Comprehensive Loss |
|
|
|
Affected Line Item in the Condensed
Consolidated Statements of Income |
|
|
Nine Months Ended |
|
|
|
|
|
|
December 31, |
|
|
|
|
|
|
2025 |
|
|
|
2024 |
|
|
|
|
Pension and other postretirement benefit items: |
|
|
|
|
|
|
|
|
|
|
Amortization of actuarial loss |
|
$ |
630 |
|
(1) |
|
$ |
586 |
|
(1) |
|
Income before provision for income taxes |
Tax effect |
|
|
146 |
|
|
|
|
135 |
|
|
|
Provision for income taxes |
|
|
$ |
484 |
|
|
|
$ |
451 |
|
|
|
Net income |
(1)These accumulated other comprehensive loss components are included within the computation of pension and other postretirement benefit costs.
NOTE 13 – DEBT:
On October 13, 2023, the Company entered into a five-year revolving credit facility with Wells Fargo Bank, National Association ("Wells Fargo") that provides a $50,000 line of credit (the "Revolving Credit Facility"). The Revolving Credit Facility has a $25,000 sub-limit for letters of credit. As of December 31, 2025, there was $0 borrowed and $6,971 letters of credit outstanding on the Revolving Credit Facility.
The Revolving Credit Facility contains customary terms and conditions, including representations and warranties and affirmative and negative covenants, as well as financial covenants for the benefit of Wells Fargo, which require the Company to maintain (i) a consolidated total leverage ratio not to exceed 3.50:1.00 and (ii) a consolidated fixed charge coverage ratio of at least 1.20:1.00, in both cases computed in accordance with the definitions and requirements specified in the Revolving Credit Facility. As of December 31, 2025, the Company was in compliance with the financial covenants of the Revolving Credit Facility.
Borrowings under the Revolving Credit Facility bear interest at a rate equal to, at the Company’s option, either (i) a forward-looking term rate based on the secured overnight financing rate ("SOFR") for the applicable interest period, subject to a floor of 0.0% per annum or (ii) a base rate determined by reference to the highest of (a) the rate of interest per annum publicly announced by the Lender as its prime rate, (b) the federal funds rate plus 0.50% per annum or (c) one-month term SOFR plus 1.00% per annum, subject to a floor of 1.00% per annum, plus, in each case, an applicable margin. The applicable margins range between (i) 1.25% per annum and 2.50% per annum in the case of any term SOFR loan and (ii) 0.25% per annum and 1.50% per annum in the case of any base rate loan, in each case based upon the Company’s then-current consolidated total leverage ratio. As of December 31, 2025, the SOFR rate was 3.87%.
The Company is required to pay a quarterly commitment fee on the unused portion of the Revolving Credit Facility during the applicable quarter at a per annum rate also determined by reference to the Company’s then-current consolidated total leverage ratio, which fee ranges between 0.10% per annum and 0.20% per annum. Any outstanding letters of credit issued under the Revolving Credit Facility will bear a fee equal to the daily amount drawn under such letters of credit multiplied by the applicable margin for the SOFR loans. As of December 31, 2025, the amount available under the Revolving Credit Facility was $43,029, subject to the interest and leverage covenants.
As of December 31, 2025, $1,478 letters of credit are outstanding with HSBC Bank USA, N.A and are cash secured. These outstanding letters of credit are subject to a fee of between 0.75% and 0.85% per annum, depending on the term of the letter of credit. As of December 31, 2025, $236 letters of credit are outstanding with Axis Bank and are cash secured. Additionally, we have a 20,000
RMB bank guaranty line of credit with China Citic Bank Co. LTD which had $542 letters of credit outstanding as of December 31, 2025. Outstanding letters of credit under this agreement are subject to a fee of 0.60% per annum.
Total letters of credit outstanding as of December 31, 2025 and March 31, 2025 were $9,226 and $10,997, respectively.
See Note 16 "Subsequent Events" for additional information regarding the Company's debt.
NOTE 14 – SEGMENT INFORMATION:
The Company has one reporting segment as its operating segments meet the requirements for aggregation. The Company and its operating subsidiaries design and manufacture mission critical fluid, power, heat transfer, vacuum and advanced mixing technologies for the Defense, Energy & Process, and Space industries. The Company also services and sells spare parts for its equipment. The Company's chief operating decision maker ("CODM") has been identified as its Chief Executive Officer who evaluates performance on an operating segment basis, as well as a consolidated basis, based on Adjusted EBITDA, which is a non-GAAP measure. This measure is used by our CODM, management, our Board of Directors, investors, lenders and other external users of our financial statements to assess our operating performance and to compare operating performance to other companies in our industry. In addition, our CODM believes Adjusted EBITDA is a useful measure to assess the earnings power of the business without the impact of capital structure and can be used to assess our ability to fund future capital expenditures in the business.
The following table provides our results as a reconciliation from consolidated Net income to our consolidated Adjusted EBITDA:
|
|
|
|
|
|
|
|
|
|
|
|
|
|
|
|
|
|
|
Three Months Ended |
|
|
Nine Months Ended |
|
|
|
December 31, |
|
|
December 31, |
|
|
|
2025 |
|
|
2024 |
|
|
2025 |
|
|
2024 |
|
Net income |
|
$ |
2,845 |
|
|
$ |
1,588 |
|
|
$ |
10,530 |
|
|
$ |
7,835 |
|
Acquisition & integration expense (income), net |
|
|
320 |
|
|
|
(220 |
) |
|
|
157 |
|
|
|
(900 |
) |
Equity-based compensation |
|
|
642 |
|
|
|
426 |
|
|
|
1,727 |
|
|
|
1,204 |
|
ERP implementation costs |
|
|
39 |
|
|
|
157 |
|
|
|
91 |
|
|
|
704 |
|
Net interest income |
|
|
(169 |
) |
|
|
(128 |
) |
|
|
(414 |
) |
|
|
(442 |
) |
Income tax expense |
|
|
358 |
|
|
|
659 |
|
|
|
1,909 |
|
|
|
2,003 |
|
Depreciation & amortization |
|
|
2,009 |
|
|
|
1,545 |
|
|
|
5,177 |
|
|
|
4,375 |
|
Adjusted EBITDA |
|
$ |
6,044 |
|
|
$ |
4,027 |
|
|
$ |
19,177 |
|
|
$ |
14,779 |
|
NOTE 15 – ACCOUNTING AND REPORTING CHANGES:
In the normal course of business, management evaluates all new Accounting Standards Updates ("ASU") and other accounting pronouncements issued by the Financial Accounting Standards Board ("FASB"), Securities and Exchange Commission, or other authoritative accounting bodies to determine the potential impact they may have on the Company’s consolidated financial statements. Other than those discussed below, management does not expect any of the recently issued accounting pronouncements, which have not already been adopted, to have a material impact on the Company’s consolidated financial statements.
In December 2023, the FASB issued ASU 2023-09, Income Taxes (Topic 740)-Improvements to Income Tax Disclosures. The ASU requires additional quantitative and qualitative income tax disclosures to allow readers of the consolidated financial statements to assess how the Company’s operations, related tax risks and tax planning affect its tax rate and prospects for future cash flows. For public business entities, the ASU is effective for annual periods beginning after December 15, 2024. The Company is currently evaluating the impact that the adoption of this ASU will have on its consolidated financial statements.
In November 2024, the FASB issued ASU No. 2024-03 “Income Statement – Reporting Comprehensive Income – Expense Disaggregation Disclosures (Subtopic 220-40): Disaggregation of Income Statement Expenses.” This ASU requires public business entities to disclose, for interim and annual reporting periods, additional information about certain income statement expense categories. The requirements are effective for fiscal years beginning after December 15, 2026, and for interim periods beginning after December 15, 2027. Entities are permitted to apply either the prospective or retrospective transition methods. The Company is currently evaluating the impact that the adoption of this ASU will have on its consolidated financial statements.
NOTE 16 – SUBSEQUENT EVENTS:
On January 23, 2026, the Company acquired FlackTek Manufacturing, LLC and FlackTek Sales, LLC (collectively “FlackTek”), a provider of advanced mixing and material processing solutions. FlackTek's systems are sold to OEMs, research and development centers, defense laboratories, and industrial manufacturers serving adhesives, sealants, functional coatings, composites, electronics, and other advanced materials markets. FlackTek adds a product portfolio with a shared customer base and an installed footprint that extends across the full value chain, from upstream to downstream production and quality control. Its mixing systems are process-critical and market-agnostic, serving defense, energetics, oil & gas, food, battery, aerospace and space, medical, and other industrial applications where precision, repeatability, and consistency drive value.
FlackTek will operate as a wholly owned subsidiary of Graham Corporation, maintaining its headquarters in Louisville, CO with a satellite location in Greenville, SC, and will be integrated into Graham’s financial, compliance, and operational infrastructure. Under the terms of the transaction, the Company acquired 100% of the equity of FlackTek for a purchase price of $35,000, which was paid 85% in cash and 15% using 76 shares of Graham’s common stock, along with the potential to earn an additional $25,000 in future performance-based cash earnouts over four years beginning with fiscal 2027, based upon achieving progressively increasing adjusted EBITDA performance targets each year.
Simultaneous with the close of the FlackTek transaction, the Company amended its Revolving Credit Facility with Wells Fargo to increase the limit to $80,000, modify the definition of Consolidated Funded Indebtedness to limit the amount of contingent earn-out liability included to the amount expected to be paid in the next twelve months, as well as permit the incurrence or existence of indebtedness of GIPL arising from any letters of credit, bank guarantees or other similar obligations in a principal amount not to exceed $5,000 and certain other administrative amendments.
Item 2. Management’s Discussion and Analysis of Financial Condition and Results of Operations
(Dollar and share amounts in thousands, except per share data)
Overview
We are a global leader in the design and manufacture of mission critical fluid, power, heat transfer, vacuum, and advanced mixing technologies for the Defense, Energy & Process, and Space industries. For the Defense industry, our equipment is used in nuclear and non-nuclear propulsion, power, fluid transfer, thermal management, and advanced mixing systems. For the Energy & Process industries we supply equipment for vacuum, heat transfer, advanced mixing, and fluid transfer applications used in oil refining, downstream chemical facilities, fertilizers, ethylene, methanol, energetics, edible oil, food & beverage, pulp & paper, medical, and multiple alternative energy applications such as hydrogen, small modular nuclear, concentrated solar, lithium extraction, and geothermal processes. For the Space industry, our equipment is used in propulsion, power, thermal management, advanced mixing, and life support systems.
Our brands are built upon engineering expertise and close customer collaboration to design, develop, and produce mission critical equipment and systems that enable our customers to meet their economic and operational objectives. Continual improvement of our processes and systems to ensure qualified and compliant equipment are hallmarks of our brand. Our early engagement with customers and support until the end of service life are values upon which our brands are built.
Our corporate headquarters is co-located with our production facilities in Batavia, NY, and we have wholly-owned subsidiaries in Arvada, CO, Jupiter, FL, Louisville, CO, and Greenville, SC and have sales and engineering offices in Houston, TX, Suzhou, China and Ahmedabad and Pune, India.
Our fiscal year ends on March 31 of each year. We refer to our fiscal year, which ends March 31, 2026, as fiscal 2026. Likewise, we refer to our fiscal year that ended March 31, 2025 and March 31, 2024 as fiscal 2025 and fiscal 2024, respectively.
Acquisitions
On October 20, 2025, we completed our acquisition of Xdot Bearing Technologies ("Xdot"), a specialized consulting, design, and engineering firm focused on foil bearing technology. Xdot will be integrated into Barber-Nichols, LLC ("BN"). We believe that combining Xdot's foil bearing technology with BN's turbomachinery expertise will significantly expand our ability to design and deliver high-speed rotating machines into new markets and applications. Xdot has annual sales of approximately $1,000 and is expected to be slightly accretive to our fiscal 2026 net income. The purchase price of this transaction was $900, subject to certain potential adjustments including a customary working capital adjustment, and was funded with cash on hand. The purchase agreement included two potential cash contingent earn-outs to be paid on the first and second anniversary of the transaction dependent upon the achievement of certain qualitative milestones totaling $600.
On January 23, 2026, we acquired FlackTek Manufacturing, LLC and FlackTek Sales, LLC (collectively, “FlackTek”), a provider of advanced mixing and material processing solutions. FlackTek’s patented technology platform delivers highly repeatable, precision mixing with significantly faster cycle times, minimal entrained air, reduced downtime between batches, consistency in production, and reduced heat transfer compared to traditional bladed methods. FlackTek’s systems are used by a global customer base that includes leading OEMs, research and development centers, defense laboratories, and industrial manufacturers serving adhesives, sealants, functional coatings, composites, electronics, and other advanced materials markets. FlackTek adds a proven product portfolio with a shared customer base and an installed footprint that extends across the full value chain, from upstream to downstream production and quality control. Its mixing systems are process-critical and market-agnostic, serving defense, energetics, oil & gas, food, battery, aerospace and space, medical, and other industrial applications where precision, repeatability, and consistency drive value. With approximately $30,000 in annualized revenue, FlackTek has built a growing installed base that generates recurring demand for consumables, accessories, and services, enhancing revenue visibility and durability.
FlackTek will operate as a wholly owned subsidiary of Graham Corporation, maintaining its headquarters in Louisville, CO with a satellite location in Greenville, SC, and will be integrated into Graham’s financial, compliance, and operational infrastructure. Under the terms of the transaction, the Company acquired 100% of the equity of FlackTek for a purchase price of $35,000, which was paid 85% in cash and 15% using 76 shares of Graham’s common stock, along with the potential to earn an additional $25,000 in future performance-based cash earnouts over four years beginning with fiscal 2027, based upon achieving progressively increasing adjusted EBITDA performance targets each year.
Summary
Highlights for the three months ended December 31, 2025 include:
•Net sales for the third quarter of fiscal 2026 were $56,701, up 21% compared with the third quarter of fiscal 2025, reflecting the strength of our diversified revenue base. This increase was across multiple markets including a 31% increase in sales to the Defense industry, primarily due to the timing of project milestones, as well as new programs and growth in existing programs. Sales to the Energy & Process market increased $2,094 or 13% over the prior year driven by Aftermarket sales, as well as
continued momentum in our New Energy markets and in particular small modular reactors (“SMRs”). Aftermarket sales to the Energy & Process and Defense markets totaled $10,815 for the quarter, 11% above the prior year. Note that historically the third quarter of our fiscal year is our lowest revenue quarter due to the holidays and a higher level of vacation being taken by our direct labor force.
•Gross profit for the third quarter of fiscal 2026 was $13,469, up $1,783 or 15% compared with the third quarter of fiscal 2025, primarily due to the increase in net sales discussed above, partially offset by a 100 basis point decline in gross profit margin to 23.8%. The decrease in gross profit margin reflects the mix of sales during the third quarter of fiscal 2026, and in particular, a high level of material receipts which carry a lower profit margin. For the first nine months of fiscal 2026, we estimate the impact of tariffs on our consolidated financial statements to be approximately $1,000 compared to the prior year. We estimate the range of potential impact of increased tariffs for the full year will be between an incremental $1,000 to $1,500 compared to the prior year. Additionally, the third quarter and the first nine months of fiscal 2025 gross profit benefited $255 and $1,460, respectively, from a grant received from the BlueForge Alliance to reimburse us for the cost of our defense welder training programs in Batavia which did not repeat in the current year.
•Selling, general and administrative expenses ("SG&A"), including intangible amortization, for the third quarter of fiscal 2026 increased $868 over the same period of fiscal 2025 and reflects the investments we are making in our operations, our employees, and our technology, higher acquisition and integration costs due to the Xdot and FlackTek acquisitions, as well as higher performance-based compensation due to our increased profitability, which was partially offset by a reversal of bad debt reserves as past due accounts were collected. SG&A costs represented 18.6% of sales for the third quarter of fiscal 2026 compared to 20.6% in fiscal 2025 as we continue to leverage our fixed overhead. In connection with the acquisition of BN, we entered into a Performance Bonus Agreement to provide employees of BN with a supplemental performance-based award based on the achievement of BN performance objectives for fiscal years 2024, 2025, and 2026, which can range between $2,000 to $4,000 per year (the "BN Performance Bonus). Performance-based compensation expense included in SG&A for the BN Performance Bonus, including applicable taxes, was $1,076 in the third quarter of fiscal 2026 and fiscal 2025.
•Net income and income per diluted share for the third quarter of fiscal 2026 were $2,845 and $0.25, respectively, compared with net income and income per diluted share of $1,588 and $0.14, respectively, for the third quarter of fiscal 2025. Adjusted net income and adjusted net income per diluted share for the third quarter of fiscal 2026 were $3,514 and $0.31, respectively, compared with adjusted net income and adjusted net income per diluted share of $1,966 and $0.18, respectively, for the third quarter of fiscal 2025. See "Non-GAAP Measures" below for a reconciliation of adjusted net income and adjusted net income per diluted share to the comparable GAAP amount.
•Orders booked in the third quarter of fiscal 2026 increased to $71,671 compared with $24,786 in the third quarter of fiscal 2025. As a result, backlog reached a record $515,633 at December 31,2025, compared with $412,335 and $384,701 at March 31, 2025 and December 31, 2024, respectively. Xdot added $509 to backlog, primarily in the Defense and Space markets. The increase in orders was primarily in the Defense and Space markets, which continue to exhibit strong tail-winds. Energy & Process orders were consistent with prior year levels, as strong demand in New Energy offset weaker Aftermarket orders. Total Aftermarket orders for the third quarter of fiscal 2026 decreased $5,151 to $7,963 from the record levels of the prior year. Note that our orders tend to be lumpy given the nature of our business (i.e. large capital projects) and in particular, orders to the Defense industry, which span multiple years and are larger in size. As of late we are seeing momentum in the small modular nuclear and cryogenics space, however the timing of large capital project orders in our traditional Energy & Process markets has pushed out due to lower gas prices and geopolitical uncertainty. For the third quarter of fiscal 2026, our book-to-bill ratio was 1.3x, above our annual goal of 1.1x. For more information on these key performance indicators see "Orders, Backlog, and Book-to-Bill Ratio" below.
•Cash and cash equivalents at December 31, 2025 were $22,254, compared with $21,577 at March 31, 2025. Cash provided by operating activities for the first nine months of fiscal 2026 of $16,084 was partially offset by net capital expenditures of $13,328 as we continue to invest in process improvement and longer-term growth opportunities. As of December 31, 2025 we had no debt outstanding. For more information see "Liquidity and Capital Resources" below.
Cautionary Note Regarding Forward-Looking Statements
This Form 10-Q and other documents we file with the Securities and Exchange Commission ("SEC") include forward-looking statements within the meaning of Section 27A of the Securities Act of 1933, as amended, and Section 21E of the Securities Exchange Act of 1934, as amended. All statements other than statements of historical fact are forward-looking statements for purposes of this Form 10-Q. These statements involve known and unknown risks, uncertainties and other factors that may cause actual results to be materially different from any future results implied by the forward-looking statements. Forward-looking statements are indicated by words such as "anticipate," "believe," "continue," "could," "estimate," "can," "may," "intend," "expect," "plan," "goal," "predict," "project," "outlook," "potential," "will," and similar words and expressions.
Forward-looking statements are not a guarantee of future performance and involve risks and uncertainties, and there are certain important factors that could cause our actual results to differ, possibly materially, from expectations or estimates reflected in such forward-looking statements including, but not limited to, those described in the "Risk Factors" section in Item 1A of our Annual Report
on Form 10-K for fiscal 2025 and elsewhere in the reports we file with the SEC. Undue reliance should not be placed on our forward-looking statements. New risks and uncertainties arise from time to time and we cannot predict these events or how they may affect us and cause actual results to differ materially from those expressed or implied by our forward-looking statements. Therefore, you should not rely on our forward-looking statements as predictions of future events. When considering these risks, uncertainties and assumptions, you should keep in mind the cautionary statements contained in this report and any documents incorporated herein by reference. You should read this document and the documents that we reference in this Form 10-Q completely and with the understanding that our actual future results may be materially different from what we expect. All forward-looking statements attributable to us are expressly qualified by these cautionary statements.
All forward-looking statements included in this Form 10-Q are made only as of the date indicated or as of the date of this Form 10-Q. Except as required by law, we undertake no obligation to update or announce any revisions to forward-looking statements contained in this report, whether as a result of new information, future events or otherwise.
Current Market Conditions
We have updated our end market disclosures to better align with how management evaluates our business and product portfolio. As part of this change, revenue previously classified as Refining, Chemical/Petrochemical, and Other, which included New Energy product sales, will now be consolidated into one market, which has been renamed “Energy & Process.” The Defense and Space end market classifications remain unchanged. Prior period amounts have been updated to reflect this change.
Defense - Demand for our equipment and systems for the Defense industry is expected to remain strong and continue to expand, based on Defense budget plans, accelerated ship build schedules due to geopolitical tensions, and the projected build schedule of submarines, aircraft carriers and undersea propulsion and power systems that we provide solutions for. In addition to U.S. Navy applications, we also provide specialty pumps, turbines, compressors, and controllers for various fluid and thermal management systems used in Department of Defense radar, laser, electronics, and power systems. We have built a leading position, and in most instances a sole source position, for certain systems and equipment for the Defense industry, which helps protect us from outside competition. We believe that we have become a strategic supplier to the Defense industry through our ability to provide quality products and meet our customers accelerated delivery schedules, which in turn may lead to awards for components on new programs, as well as additional content on the programs we already supply.
Energy & Process - Our traditional Energy markets are undergoing significant transition. While we expect that fossil fuels will continue to be an important component in the global Energy industry for many years to come, there are significant changes in the priorities for capital investments by our customers and the regions in which those investments are being made. We expect that the systemic changes in the Energy markets, which are influenced by the increasing use by consumers of alternative fuels and government policies to stimulate their usage, will likely lead to demand growth for fossil-based fuels that is less than the global growth rate. Additionally, as of late we are seeing the timing of large capital project orders in our traditional Energy & Process markets being pushed out due to lower gas prices, tariffs, and geopolitical uncertainty, which has cause them to delay capital investment. Accordingly, we believe that in the near term the quantity of projects available for us to compete for will remain low and that new project pricing will remain challenging. Additionally, we believe that the majority of new capital investment orders in our traditional Energy markets will be outside the U.S., such as India and the Middle-East. Finally, over the last few years we have experienced an increase in our Energy & Process Aftermarket orders primarily from the domestic market as our customers continue to maintain and invest in the facilities they currently operate.
Over the long-term, we expect that population growth, an expanding global middle class, and an increasing desire for improved quality of life and access to consumer products will drive increased demand for industrial goods within the plastics and resins value chain along with fertilizers and related Process markets. As such, we expect investment in new global process capacity will improve and drive growth in demand for our products and services.
The alternative and clean energy opportunities for our heat transfer, power production, and fluid transfer systems are expected to continue to grow. We assist in designing, developing, and producing equipment for hydrogen production, distribution and fueling systems, concentrated solar power and storage, lithium extraction, small modular reactors ("SMRs"), bio-energy products, and geothermal power generation. As a result of increased energy demands driven by population growth, crypto-currency mining, and artificial intelligence ("AI") data centers, we have seen an increase in activity and orders related to SMRs which we expect to continue for the foreseeable future. We believe we are positioned to be a significant contributor as these markets continue to develop.
We intend to stay competitive in our traditional Energy & Process markets by investing in technology. One example of this is our NextGen™ steam ejector nozzle, which has been engineered to reduce steam consumption, lower operating costs, and increase system capacity, allowing refineries and process plants to enhance throughput while minimizing their carbon footprint. We estimate that the total market opportunity for our NextGen™ nozzle exceeds $50,000 over the next 5 to 10 years.
Space - Our turbomachinery, pumps, and cryogenic products and market access provide revenue and growth potential in the commercial Space/Aerospace markets. The commercial Space market has grown and evolved rapidly, and we provide full life-cycle support for rocket engine turbopump systems and components to many of the industry leading launch providers for satellites. We expect
that over the long term, extended space exploration will become more prevalent, and we anticipate that our thermal/fluid management and environmental control and life support system turbomachinery will play important roles. We are also participating in future aerospace power and propulsion system development through supply of fluid and thermal management systems components. Small, power dense systems are imperative for these applications, and we believe our technology and expertise will enable us to achieve sales growth in this market. Sales and orders to the Space industry are variable in nature and many of our customers, who are key players in the industry, have yet to achieve profitability and may be unable to continue operations without additional funding. As a result, future revenue and growth in the space market can be uncertain due to high dependency on launch provider commercialization, timing, and success.
As illustrated below, we have succeeded over the last several years with our strategy to increase our participation in the defense market, which comprised 85% of our total backlog at December 31, 2025.
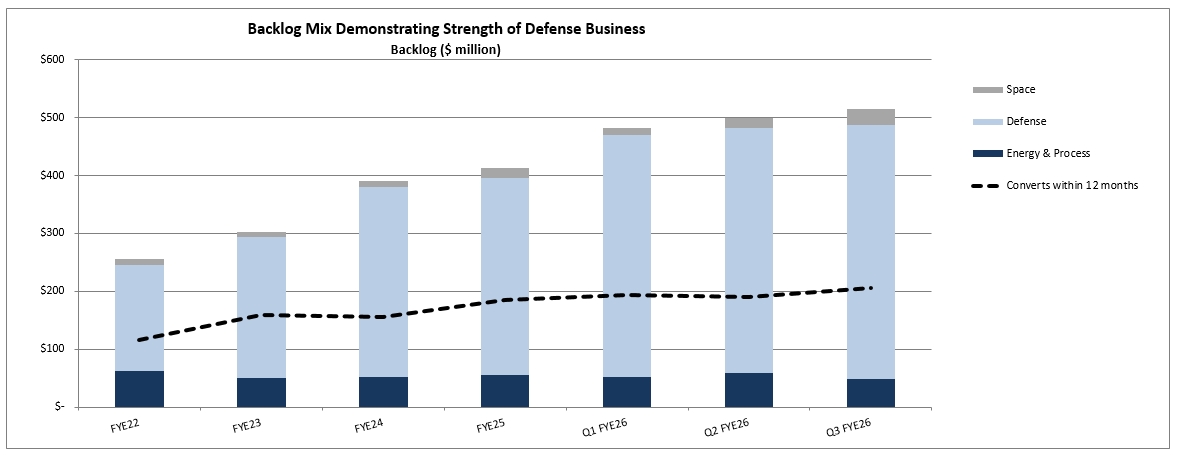
*Note: "FYE" refers to fiscal year ended March 31. For more information on these key performance indicators see "Orders, Backlog, and Book-to-Bill Ratio" below.
Results of Operations
To better understand the significant factors that influenced our performance during the periods presented, the following discussion should be read in conjunction with our Unaudited Condensed Consolidated Financial Statements and the notes to our Unaudited Condensed Consolidated Financial Statements included in Part I, Item 1, of this Form 10-Q.
The following table summarizes our results of operations for the periods indicated:
|
|
|
|
|
|
|
|
|
|
|
|
|
|
|
|
|
|
|
Three Months Ended |
|
|
Nine Months Ended |
|
|
|
December 31, |
|
|
December 31, |
|
|
|
2025 |
|
|
2024 |
|
|
2025 |
|
|
2024 |
|
Net sales |
|
$ |
56,701 |
|
|
$ |
47,037 |
|
|
$ |
178,215 |
|
|
$ |
150,551 |
|
Gross profit |
|
$ |
13,469 |
|
|
$ |
11,686 |
|
|
$ |
42,496 |
|
|
$ |
36,853 |
|
Gross profit margin |
|
|
23.8 |
% |
|
|
24.8 |
% |
|
|
23.8 |
% |
|
|
24.5 |
% |
SG&A expenses |
|
$ |
10,564 |
|
|
$ |
9,696 |
|
|
$ |
30,623 |
|
|
$ |
28,130 |
|
SG&A as a percent of sales |
|
|
18.6 |
% |
|
|
20.6 |
% |
|
|
17.2 |
% |
|
|
18.7 |
% |
Net income |
|
$ |
2,845 |
|
|
$ |
1,588 |
|
|
$ |
10,530 |
|
|
$ |
7,835 |
|
Income per diluted share |
|
$ |
0.25 |
|
|
$ |
0.14 |
|
|
$ |
0.95 |
|
|
$ |
0.71 |
|
The following tables provide our net sales by product line and geographic region including the percentage of total and change in comparison to the prior year for each category and period presented. Percentages may not sum to the total due to rounding:
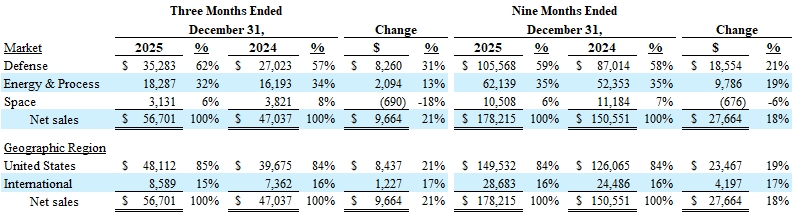
Third Quarter and First Nine Months of Fiscal 2026 Compared with Third Quarter and First Nine Months of Fiscal 2025
Net sales for the third quarter of fiscal 2026 were $56,701, up 21% compared with the third quarter of fiscal 2025, reflecting the strength of our diversified revenue base. This increase was across multiple markets including a 31% increase in sales to the Defense industry, primarily due to the timing of project milestones, as well as new programs and growth in existing programs. Sales to the Energy & Process market increased $2,094 or 13% over the prior year driven by Aftermarket sales, as well as continued momentum in our New Energy markets and in particular small modular reactors (“SMRs”). Aftermarket sales to the Energy & Process and Defense markets totaled $10,815 for the quarter, 11% above the prior year. Note that historically the third quarter of our fiscal year is our lowest revenue quarter due to the holidays and a higher level of vacation being taken by our direct labor force.
Domestic sales as a percentage of aggregate sales were 85% in the third quarter of fiscal 2026, comparable to the 84% in the third quarter of fiscal 2025, consistent with our increased Defense revenue, which is U.S. based. Sales for the three months ended December 31, 2025 were 62% to the defense industry compared to 57% for the comparable quarter in fiscal 2025.
Net sales for the first nine months of fiscal 2026 increased $27,664, or 18%, from the first nine months of fiscal 2025, reflecting the strength of our diversified revenue base. This increase was across multiple markets including a $18,554 or 21% increase in sales to the Defense industry, primarily due to the timing of project milestones (material receipts), as well as new programs and growth in exiting programs. Net sales for the first nine months of fiscal 2026 for the Energy & Process markets increased $9,786 or 19%, driven by increased sales in China and larger capital projects, partially offset by lower sales in India, all due to project timing. Additionally, Aftermarket sales to the Energy & Process and Defense markets of $28,757 for the first nine months of fiscal 2026 were 3% lower than the record levels of the prior year.
Domestic sales as a percentage of aggregate sales were 84% for the first nine months of fiscal 2026, comparable to the 84% for the same period of fiscal 2025, reflecting our continued presence in the defense industry, which is U.S. based. Sales for the nine months ended December 31, 2025 were 59% to the defense industry compared to 58% for the comparable quarter in fiscal 2025. Fluctuation in sales among markets, products and geographic locations varies, sometimes significantly, from quarter-to-quarter based on timing and magnitude of projects. See also "Current Market Conditions," above. For additional information on anticipated future sales and our markets, see "Orders, Backlog and Book-to-Bill Ratio" below.
Gross profit for the third quarter of fiscal 2026 was $13,469, up $1,783 or 15% compared with the third quarter of fiscal 2025, primarily due to the increase in net sales discussed above partially offset by a 100 basis point decline in gross profit margin to 23.8%. Gross profit for the first nine months of fiscal 2026 was $42,496, up $5,643 or 15% compared with the same period of fiscal 2025, primarily due to the increase in net sales discussed above partially offset by a 70 basis point decline in gross profit margin to 23.8%. The decrease in gross profit margin reflects the mix of sales during the fiscal 2026 periods, and in particular, a high level of material receipts which carry a lower profit margin. For the first nine months of fiscal 2026, we estimate the impact of tariffs on our consolidated financial statements to be approximately $1,000 compared to the prior year. We estimate the range of potential impact of increased tariffs for the full year will be between an incremental $1,000 to $1,500 compared to the prior year. Additionally, the third quarter and the first nine months of fiscal 2025 gross profit benefited $255 and $1,460, respectively, from a grant received from the BlueForge Alliance to reimburse us for the cost of our defense welder training programs in Batavia, which did not repeat in the current year.
Changes in SG&A expense, including amortization expense, for the three and nine months ending December 31, 2025 versus the comparable prior year period is as follows:
|
|
|
|
|
|
|
|
|
|
|
Change Q3 FY26 vs. Q3 FY25 |
|
|
Change YTD Q3 FY26 vs. YTD Q3 FY25 |
|
Personnel costs |
|
$ |
597 |
|
|
$ |
1,665 |
|
Acquisition & integration expense |
|
|
539 |
|
|
|
597 |
|
Performance-based compensation |
|
|
100 |
|
|
|
672 |
|
Professional fees |
|
|
144 |
|
|
|
(4 |
) |
Equity based compensation |
|
|
137 |
|
|
|
512 |
|
ERP implementation costs |
|
|
(119 |
) |
|
|
(613 |
) |
Bad debt expense |
|
|
(769 |
) |
|
|
(369 |
) |
All other |
|
|
239 |
|
|
|
33 |
|
Total SG&A change |
|
$ |
868 |
|
|
$ |
2,493 |
|
Selling, general and administrative expenses ("SG&A"), including intangible amortization, for the third quarter of fiscal 2026 increased $868 over the same period of fiscal 2025 and reflects the investments we are making in our operations, our employees, and our technology, higher acquisition and integration costs due to the Xdot and FlackTek acquisitions, as well as higher performance-based compensation due to our increased profitability, which was partially offset by a reversal of bad debt reserves as past due accounts were collected. SG&A costs represented 18.6% of sales for the third quarter of fiscal 2026 compared to 20.6% in fiscal 2025 as we continue to leverage our fixed overhead. In connection with the acquisition of BN, we entered into a Performance Bonus Agreement to provide employees of BN with a supplemental performance-based award based on the achievement of BN performance objectives for fiscal years 2024, 2025, and 2026, which can range between $2,000 to $4,000 per year. Performance-based compensation expense included in SG&A for the BN Performance Bonus, including applicable taxes, was $1,076 in the third quarter of fiscal 2026 and fiscal 2025. During the first nine months of fiscal 2026 and fiscal 2025 we recorded $3,228 related to the BN Performance Bonus inclusive of applicable taxes.
Other operating income represents the change in fair value of the P3 Technologies, LLC ("P3") and Xdot contingent earn-out liabilities and was $219 and $486 for the three and nine month periods ended December 31, 2025, respectively, versus $220 and $946 for the comparable prior year periods of fiscal 2025. The change in fair value for P3 was due to delayed orders/projects that extended beyond the earnout period.
Net interest income for the third quarter and first nine months of fiscal 2026 was $169 and $414, respectively, compared to $128 and $442 for the comparable periods of fiscal 2025, respectively. This net interest income reflects our strong cash position and low debt levels.
On July 4, 2025, President Trump signed the One Big Beautiful Bill Act ("OBBB"), enacting a broad range of tax reform provisions, including extending and modifying certain domestic and international Tax Cut & Jobs Act provisions and expanding certain Inflation Reduction Act incentives while accelerating the phase-out of others. Only certain provisions will have current-year financial reporting implications due to varying effective dates and discretionary elections. The enactment of the OBBB in the second quarter of fiscal 2026 resulted in an increase to our expected effective tax rate for fiscal 2026 of approximately 200 basis points but is expected to result in approximately $8,000 in cash tax savings over the next two years due to the bonus depreciation provisions of the OBBB and changes to the research and development Section 174 rules. These cash tax savings are expected to more than offset the impact of the effective tax rate increase. For fiscal 2026, we expect our effective tax rate to be between 16% and 18%, as the impact of higher than expected discrete tax items in fiscal 2026 offset the impact of the OBBB on our full year effective tax rate.
Our effective tax rate for the third quarter of fiscal 2026 was 11%, compared with 29% in the third quarter of fiscal 2025. Our effective tax rate for the first nine months of fiscal 2025 was 15%, compared with 20% for the first nine months of fiscal 2025. Our effective tax rate can vary significantly from quarter to quarter depending on the level of projected pre-tax income, the amount of projected income derived from our higher tax rate foreign subsidiaries, changes in tax laws, as well as the timing of discrete tax items. The decrease in our effective tax rate for the third quarter of fiscal 2026 was primarily due to higher than expected research and development tax credits. The decrease in our effective tax rate for the nine month period of fiscal 2026 was primarily due to a higher discrete tax benefit recognized in the first quarter of fiscal 2026 related to the vesting of restricted stock awards and the Company's improved stock price over the last year and the higher than expected research and development tax credits recognized in the third quarter of fiscal 2026, partially offset by the impact of the enactment of the OBBB discussed above.
The net result of the above is that net income and income per diluted share for the third quarter of fiscal 2026 were $2,845 and $0.25, respectively, compared with $1,588 and $0.14, respectively, for the third quarter of fiscal 2025. Adjusted net income and adjusted net income per diluted share for the third quarter of fiscal 2025 were $3,514 and $0.31, respectively, compared with adjusted net income and adjusted net income per diluted share of $1,966 and $0.18, respectively, for the third quarter of fiscal 2025. See "Non-GAAP Measures" below for a reconciliation of adjusted net income and adjusted net income per diluted share to the comparable GAAP amount.
Net income and income per diluted share for the first nine months of fiscal 2026 were $10,530 and $0.95, respectively, compared with net income of $7,835 and $0.71, respectively, for the first nine months of fiscal 2025. Adjusted net income and adjusted net income
per diluted share for the first nine months of fiscal 2026 were $11,881 and $1.07, respectively, compared with adjusted net income and adjusted net income per diluted share of $8,965 and $0.81, respectively, for the first nine months of fiscal 2025. See "Non-GAAP Measures" below for a reconciliation of adjusted net income and adjusted net income per diluted share to the comparable GAAP amount.
Non-GAAP Measures
Adjusted net income before net interest (income) expense, income taxes, depreciation and amortization ("EBITDA"), adjusted net income, and adjusted net income per diluted share are provided for informational purposes only and are not measures of financial performance under accounting principles generally accepted in the U.S. ("GAAP").
Management believes the presentation of these financial measures reflecting non-GAAP adjustments provides important supplemental information to investors and other users of our financial statements in evaluating the operating results of the Company. In particular, we exclude those charges and credits that are not directly related to our operating performance, and are not reflective of our underlying business particularly in light of their unpredictable nature. These non-GAAP disclosures have limitations as analytical tools, should not be viewed as a substitute for net income or net income per diluted share determined in accordance with GAAP, and should not be considered in isolation or as a substitute for analysis of our results as reported under GAAP, nor are they necessarily comparable to non-GAAP performance measures that may be presented by other companies. In addition, supplemental presentation should not be construed as an inference that our future results will be unaffected by similar adjustments to net income or net income per diluted share determined in accordance with GAAP. Adjusted EBITDA, adjusted net income and adjusted net income per diluted share are key metrics used by management and our board of directors to assess the Company’s financial and operating performance and adjusted EBITDA is a basis for a significant portion of management's performance-based compensation.
Adjusted EBITDA excludes charges for depreciation, amortization, net interest (income) expense, income taxes, acquisition related (income) expenses, equity-based compensation, ERP implementation costs, and other unusual/nonrecurring items. Adjusted net income and adjusted net income per diluted share exclude intangible amortization, acquisition related (income) expenses, ERP implementation costs, other unusual/nonrecurring items, and the related tax impacts of those adjustments.
A reconciliation of adjusted EBITDA, adjusted net income and adjusted net income per diluted share to net income in accordance with GAAP is as follows:
|
|
|
|
|
|
|
|
|
|
|
|
|
|
|
|
|
Three Months Ended |
|
|
Nine Months Ended |
|
|
December 31, |
|
|
December 31, |
|
|
2025 |
|
|
2024 |
|
|
2025 |
|
|
2024 |
|
Net income |
$ |
2,845 |
|
|
$ |
1,588 |
|
|
$ |
10,530 |
|
|
$ |
7,835 |
|
Acquisition & integration expense (income), net |
|
320 |
|
|
|
(220 |
) |
|
|
157 |
|
|
|
(900 |
) |
Equity-based compensation |
|
642 |
|
|
|
426 |
|
|
|
1,727 |
|
|
|
1,204 |
|
ERP implementation costs |
|
39 |
|
|
|
157 |
|
|
|
91 |
|
|
|
704 |
|
Net interest income |
|
(169 |
) |
|
|
(128 |
) |
|
|
(414 |
) |
|
|
(442 |
) |
Income tax expense |
|
358 |
|
|
|
659 |
|
|
|
1,909 |
|
|
|
2,003 |
|
Depreciation & amortization |
|
2,009 |
|
|
|
1,545 |
|
|
|
5,177 |
|
|
|
4,375 |
|
Adjusted EBITDA |
$ |
6,044 |
|
|
$ |
4,027 |
|
|
$ |
19,177 |
|
|
$ |
14,779 |
|
|
|
|
|
|
|
|
|
|
|
|
|
Net Sales |
|
56,701 |
|
|
|
47,037 |
|
|
|
178,215 |
|
|
|
150,551 |
|
Net income as a % of revenue |
|
5.0 |
% |
|
|
3.4 |
% |
|
|
5.9 |
% |
|
|
5.2 |
% |
Adjusted EBITDA as a % of revenue |
|
10.7 |
% |
|
|
8.6 |
% |
|
|
10.8 |
% |
|
|
9.8 |
% |
|
|
|
|
|
|
|
|
|
|
|
|
|
|
|
|
|
|
|
|
|
|
|
|
|
|
|
|
|
|
|
Three Months Ended |
|
|
Nine Months Ended |
|
|
December 31, |
|
|
December 31, |
|
|
2025 |
|
|
2024 |
|
|
2025 |
|
|
2024 |
|
Net income |
$ |
2,845 |
|
|
$ |
1,588 |
|
|
$ |
10,530 |
|
|
$ |
7,835 |
|
Acquisition & integration expense (income), net |
|
320 |
|
|
|
(220 |
) |
|
|
157 |
|
|
|
(900 |
) |
Amortization of intangible assets |
|
510 |
|
|
|
554 |
|
|
|
1,507 |
|
|
|
1,663 |
|
ERP implementation costs |
|
39 |
|
|
|
157 |
|
|
|
91 |
|
|
|
704 |
|
Tax impact of adjustments(1) |
|
(200 |
) |
|
|
(113 |
) |
|
|
(404 |
) |
|
|
(337 |
) |
Adjusted net income |
$ |
3,514 |
|
|
$ |
1,966 |
|
|
$ |
11,881 |
|
|
$ |
8,965 |
|
|
|
|
|
|
|
|
|
|
|
|
|
GAAP net income per diluted share |
$ |
0.25 |
|
|
$ |
0.14 |
|
|
$ |
0.95 |
|
|
$ |
0.71 |
|
Adjusted net income per diluted share |
$ |
0.31 |
|
|
$ |
0.18 |
|
|
$ |
1.07 |
|
|
$ |
0.81 |
|
Diluted weighted average common shares outstanding |
|
11,157 |
|
|
|
11,057 |
|
|
|
11,108 |
|
|
|
11,016 |
|
|
|
(1) Applies a normalized tax rate to non-GAAP adjustments, which are pre-tax, based upon the statutory tax rate of 23%. |
|
|
|
Acquisition and integration (income) costs, net are incremental costs that are directly related to and as a result of the P3, Xdot, and FlackTek acquisitions or the subsequent accounting for the related contingent earn-out liabilities. These costs (income) may include, among other things, professional, consulting and other fees, system integration costs, and contingent consideration fair value adjustments. ERP implementation costs primarily relate to consulting costs (training, data conversion, and project management) incurred in connection with the ERP system being implemented throughout our Batavia, New York facility in order to enhance efficiency and productivity and are not expected to recur once the project is completed.
Liquidity and Capital Resources
The following discussion should be read in conjunction with our Unaudited Condensed Consolidated Balance Sheets and Unaudited Condensed Consolidated Statements of Cash Flows:
|
|
|
|
|
|
|
|
|
|
|
December 31, |
|
|
March 31, |
|
|
|
2025 |
|
|
2025 |
|
Cash and cash equivalents |
|
$ |
22,254 |
|
|
$ |
21,577 |
|
Working capital (1) |
|
|
9,145 |
|
|
|
5,222 |
|
Working capital ratio(1) |
|
|
1.1 |
|
|
|
1.0 |
|
(1)Working capital equals current assets minus current liabilities. Working capital ratio equals current assets divided by current liabilities.
Net cash provided by operating activities for the first nine months of fiscal 2026 was $16,084 compared with $27,873 for the first nine months of fiscal 2025. This decrease was a result of an increase in working capital, primarily due to the timing of collection of accounts receivable and customer deposits, partially offset by higher cash net income.
Net capital expenditures for the first nine months of fiscal 2026 were $13,328 compared to $13,800 for the comparable period in fiscal 2025. Capital expenditures for fiscal 2026 primarily relate to machinery and equipment, as well as for buildings and leasehold improvements to support our growth and productivity improvement initiatives and were primarily related to the following:
•Construction of a new 30,000 square foot manufacturing facility to enhance and expand Defense production capabilities at our Batavia, NY facility, which is primarily being funded by a $13,500 strategic grant from one of our Defense customers. Construction of this facility was completed in July 2025.
•Construction of a cryogenic propellant (LH2, LOX, LCH4) testing facility near P3 in Florida to support our customers and enhance our capabilities. Construction was completed in February 2026.
•Installation of advanced Radiographic Testing (“RT”) equipment to enhance and accelerate Defense production at our Batavia, NY facility, which is primarily being funded by a $2,200 strategic grant from one of our Defense customers. We intend to contribute an additional $1,400 towards this project for a total project cost of $3,600. This expansion is expected to be completed in the fourth quarter of fiscal 2026.
•Investments in production capacity and capabilities at our Arvada, CO facility, including the addition of new CNC machining centers, a liquid nitrogen test stand, and supporting infrastructure to increase throughput and meet accelerating Space customer schedules.
Capital expenditures for fiscal 2026 are expected to be between $15,000 and $18,000 of which approximately two-thirds is related to the completion of the initiatives discussed above. The remaining capital expenditures for fiscal 2026 are discretionary. We estimate that our maintenance capital spend is approximately $2,000 per year. However, for the next several years we expect capital expenditures to be approximately 7% to 10% of sales each year as we continue to invest in our business in order to support our long-term organic growth goals.
Cash and cash equivalents were $22,254 at December 31, 2025 compared with $21,577 at March 31, 2025, up $677 primarily due to cash provided by operations, offset by capital expenditures. At December 31, 2025, $1,714 of our cash and cash equivalents was used to secure our letters of credit and $4,082 of our cash was held by foreign subsidiaries.
On October 13, 2023, we entered into a five-year revolving credit facility with Wells Fargo that provides a $50,000 line of credit (the "Revolving Credit Facility"). As of December 31, 2025, there were no borrowings and $6,971 letters of credit outstanding on the Revolving Credit Facility and the amount available to borrow was $43,029, subject to interest and leverage covenants.
The Revolving Credit Facility contains customary terms and conditions, including representations and warranties and affirmative and negative covenants, as well as financial covenants for the benefit of Wells Fargo, which require us to maintain (i) a consolidated total leverage ratio not to exceed 3.50:1.00 and (ii) a consolidated fixed charge coverage ratio of at least 1.20:1.00, in both cases computed in accordance with the definitions and requirements specified in the Revolving Credit Facility. As of December 31, 2025, we were in compliance with the financial covenants of the Revolving Credit Facility and our leverage ratio as calculated in accordance with the terms of the Revolving Credit Facility was 0.4x.
The Revolving Credit Facility contains terms that may, under certain circumstances as defined in the agreement, restrict our ability to declare or pay dividends. Any determination by our Board of Directors regarding dividends in the future will depend on a variety of factors, including our future financial performance, organic and inorganic growth opportunities, general economic conditions, and financial, competitive, regulatory, and other factors, many of which are beyond our control. We did not pay any dividends during the first nine months of fiscal 2026 or during fiscal 2025 and currently have no intention to pay dividends for the foreseeable future. There can be no guarantee that we will pay dividends in the future.
Simultaneous with the close of the FlackTek transaction, we amended our Revolving Credit Facility to increase the limit to $80,000, modify the definition of Consolidated Funded Indebtedness to limit the amount of contingent earn-out liability included to the amount expected to be paid in the next twelve months, as well as permit the incurrence or existence of indebtedness of Graham India Private Limited ("GIPL") arising from any letters of credit, bank guarantees or other similar obligations in a principal amount not to exceed $5,000 and certain other administrative amendments. Following the closing of the transaction, Graham’s pro forma leverage ratio is approximately 1.2x.
We did not have any off-balance sheet arrangements as of December 31, 2025 and 2024, other than letters of credit incurred in the ordinary course of business.
We believe that cash generated from operations combined with the liquidity provided by our Revolving Credit Facility will be adequate to meet our cash needs for the immediate future.
Orders, Backlog, and Book-to-Bill Ratio
In addition to the non-GAAP measures discussed above, management uses the following key performance metrics to analyze and measure our financial performance and results of operations: orders, backlog, and book-to-bill ratio. Management uses orders and backlog as measures of current and future business and financial performance and these may not be comparable with measures provided by other companies. Orders represent definitive agreements with customers to provide products and/or services. Backlog is defined as the total dollar value of net orders received for which revenue has not yet been recognized. Total backlog can include both funded and unfunded orders under government contracts. Management believes tracking orders and backlog are useful as it often times is a leading indicator of future performance. In accordance with industry practice, contracts may include provisions for cancellation, termination, or suspension at the discretion of the customer.
The book-to-bill ratio is an operational measure that management uses to track the growth prospects of the Company. The Company calculates the book-to-bill ratio for a given period as net orders divided by net sales. Over the long-term our goal is to have a book-to-bill ratio of 1.1x, which can vary significantly from quarter to quarter given the nature of our business. Since fiscal 2020, our annual book-to-bill ratio has ranged from 0.9x to 1.4x, however, our quarterly book-to-bill ratio over that same time period has ranged from 0.5x to 2.8x.
Given that each of orders, backlog, and book-to-bill ratio is an operational measure and that the Company's methodology for calculating orders, backlog, and book-to-bill ratio does not meet the definition of a non-GAAP measure, as that term is defined by the SEC, a quantitative reconciliation for each is not required or provided.
The following tables provide our orders by market and geographic region including the percentage of total orders and change in comparison to the prior year for each category and period presented. Percentages may not sum to the total due to rounding:
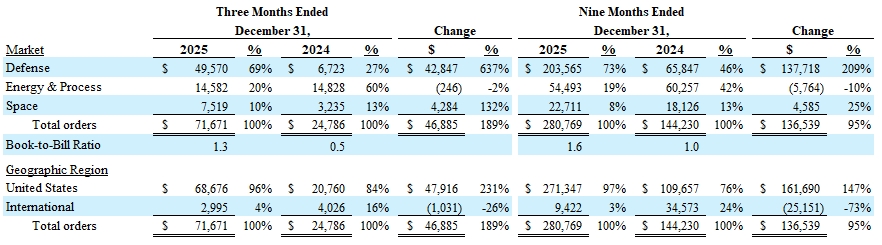
Orders booked in the third quarter of fiscal 2026 were $71,671 or 1.3x net sales for the quarter. Orders booked for the first nine months of fiscal 2026 were $280,769 or 1.6x net sales for the period. As a result, backlog increased $15,561 (3%) during the quarter and $103,298 (25%) for the first nine months of fiscal 2026 to $515,633 at December 31, 2025. Backlog acquired from Xdot totaled $509 during the quarter. The increase in orders during the quarter were in the Defense and Space markets, which continue to exhibit strong tail-winds. Energy & Process orders were consistent with prior year levels, as strong demand in New Energy offset weaker Aftermarket orders. Total Aftermarket orders for the third quarter of fiscal 2026 decreased $5,151 to $7,963 from the record levels of the prior year. In addition to the above, orders for the first nine months of fiscal 2026 included $86,500 of follow-on orders to support the U.S. Navy's Virginia Class Submarine program recorded in the first quarter, and a $25,500 follow-on order to provide mission-critical hardware for the MK48 Mod 7 Heavyweight Torpedo recorded in the second quarter of fiscal 2026. Aftermarket orders for the Energy & Process and Defense markets for the first nine months of fiscal 2026 decreased 23% in comparison to the prior year record levels.
Orders to the U.S. represented 97% of total orders for the first nine months of fiscal 2025 compared to 76% for the prior year. These orders were primarily to the Defense market, which are U.S. based.
The following table provides our backlog by market, including the percentage of total backlog, for each category and period presented. Percentages may not sum to the total due to rounding:
|
|
|
|
|
|
|
|
|
|
|
|
|
|
|
|
|
|
|
|
|
|
|
|
December 31, |
|
|
|
|
December 31, |
|
|
|
Change |
|
Market |
|
2025 |
|
% |
|
|
2024 |
|
% |
|
$ |
|
|
% |
|
Defense |
|
$ |
438,762 |
|
|
85 |
% |
|
$ |
307,138 |
|
|
80 |
% |
$ |
131,624 |
|
|
|
43 |
% |
Energy & Process |
|
|
48,274 |
|
|
9 |
% |
|
|
59,969 |
|
|
16 |
% |
|
(11,695 |
) |
|
|
-20 |
% |
Space |
|
|
28,597 |
|
|
6 |
% |
|
|
17,594 |
|
|
5 |
% |
|
11,003 |
|
|
|
63 |
% |
Total backlog |
|
$ |
515,633 |
|
|
100 |
% |
|
$ |
384,701 |
|
|
100 |
% |
$ |
130,932 |
|
|
|
34 |
% |
Backlog was $515,633 at December 31, 2025, a 34% increase over the prior year period. We expect to recognize revenue on approximately 35% to 40% of the backlog within one year, 25% to 30% in one to two years, and the remaining beyond two years. The majority of the orders that are expected to convert beyond twenty-four months are for the defense industry, specifically the U.S. Navy, that have a long conversion cycle (up to six years).
Outlook
We are providing the following fiscal 2026 outlook, which includes the impact of the Xdot and FlackTek acquisitions ($ in thousands):
|
|
|
|
|
New Guidance |
|
Previous Guidance |
Net Sales |
$233,000 to $239,000 |
|
$225,000 to $235,000 |
Gross Profit (1) |
24.0% - 25.0% of sales |
|
24.5% - 25.5% of sales |
SG&A Expenses (Including Amortization)(2) |
17.5% - 18.5% of sales |
|
17.5% - 18.5% of sales |
Tax Rate |
16% to 18% |
|
20% to 22% |
Adjusted EBITDA(1)(3) |
$24,000 to $28,000 |
|
$22,000 to $28,000 |
Capital Expenditures |
$15,000 to $18,000 |
|
$15,000 to $18,000 |
|
|
|
|
(1) Includes the estimated impact of increased tariffs over the prior year of approximately $1,000 to $1,500. |
(2) Includes approximately $7,000 to $8,000 of BN Performance Bonus, equity-based compensation, acquisition & integration costs, and ERP conversion costs included in SG&A expense. |
(3) Excludes net interest (income) expense, income taxes, depreciation and amortization from net income, as well as approximately $3,000 to $4,000 of equity-based compensation, net acquisition & integration costs, and ERP conversion costs. |
See "Cautionary Note Regarding Forward-Looking Statement" and "Non-GAAP Measures" above for additional information about forward-looking statements and non-GAAP measures. We have not reconciled non-GAAP forward-looking adjusted EBITDA to its most directly comparable GAAP measure, as permitted by Item 10(e)(1)(i)(B) of Regulation S-K. Such reconciliation would require unreasonable efforts to estimate and quantify various necessary GAAP components largely because forecasting or predicting our future operating results is subject to many factors out of our control or not readily predictable.
We have made significant progress with the advancements in our business, which puts us on track to achieve our fiscal 2027 goals of 8% to 10% average annualized organic revenue growth and adjusted EBITDA margins in the low to mid-teens.
Our expectations for sales and profitability assume that we will be able to operate our production facilities at planned capacity, have access to our global supply chain including our subcontractors, do not experience significant global health related disruptions, and assumes no further impact from any other unforeseen events.
Contingencies and Commitments
We have been named as a defendant in lawsuits alleging personal injury from exposure to asbestos allegedly contained in or accompanying our products or from exposure to asbestos at the Company's facilities. We are a co-defendant with numerous other defendants in these lawsuits and intend to vigorously defend ourselves against these claims. The claims in our current lawsuits are similar to those made in previous asbestos lawsuits that named us as a defendant. Such previous lawsuits either were dismissed when it was shown that we had not supplied products to the plaintiffs’ places of work, or were settled by us for immaterial amounts. We believe that the resolution of these asbestos-related lawsuits will not have a material adverse effect on our financial position or results of operations. However, legal matters are subject to inherent uncertainties and there exists the possibility that the ultimate resolution of these asbestos-related lawsuits could have a material adverse impact on our financial position and results of operations.
During the third quarter of fiscal 2024, the Audit Committee of the Board of Directors, with the assistance of external counsel and forensic professionals, concluded an investigation into a whistleblower complaint received regarding GIPL. The investigation identified evidence supporting the complaint and other misconduct by employees. The other misconduct was over a period of four years, was not deemed to be material, and was isolated to a few employees. All involved employees have been terminated or are no longer with the Company and we have implemented remedial actions, including strengthening our compliance program and internal controls. As a result of the investigation, during the third quarter of fiscal 2024, the statutory auditor and bookkeeper of GIPL tendered their resignations and new firms were appointed. We have voluntarily reported the findings of our investigation to the appropriate authorities in India, the U.S. Department of Justice, and the SEC and will continue to cooperate with those authorities. Although the resolutions of these matters are inherently uncertain, we do not believe any remaining impact will be material to our overall consolidated results of operations, financial position, or cash flows.
As of December 31, 2025, we are subject to the claims noted above, as well as other legal proceedings and potential claims that have arisen in the ordinary course of business. Although the outcome of the lawsuits, legal proceedings or potential claims to which we are or may become a party cannot be determined and an estimate of the reasonably possible loss or range of loss cannot be made for the majority of the claims, we do not believe that the outcomes, either individually or in the aggregate, will have a material adverse effect on our results of operations, financial position or cash flows. See Note 10 to the Condensed Consolidated Financial Statements included in Part I, Item 1 of this Form 10-Q for additional information.
Critical Accounting Policies, Estimates, and Judgments
Our Condensed Consolidated Financial Statements are based on the selection of accounting policies and the application of significant accounting estimates, some of which require management to make significant assumptions. We believe that the most critical accounting estimates used in the preparation of our Condensed Consolidated Financial Statements relate to labor hour estimates, total cost, and establishment of operational milestones, which are used to recognize revenue over time, accounting for contingencies, under
which we accrue a loss when it is probable that a liability has been incurred and the amount can be reasonably estimated, and accounting for business combinations and intangible assets. For further information, refer to Item 7 "Management's Discussion and Analysis of Financial Condition and Results of Operations" and Item 8 "Financial Statements and Supplementary Data" included in our Annual Report on Form 10-K for the year ended March 31, 2025.
New Accounting Pronouncements
In the normal course of business, management evaluates all new Accounting Standards Updates and other accounting pronouncements issued by the Financial Accounting Standards Board, SEC, or other authoritative accounting bodies to determine the potential impact they may have on the Company’s Condensed Consolidated Financial Statements. Other than those discussed in the Condensed Consolidated Financial Statements, management does not expect any of the recently issued accounting pronouncements, which have not already been adopted, to have a material impact on the Company’s Condensed Consolidated Financial Statements. For discussion of the newly issued accounting pronouncements, see Note 15 to the Condensed Consolidated Financial Statements included in Part I, Item 1 of this Form 10-Q for additional information.
Item 3. Quantitative and Qualitative Disclosures About Market Risk
The principal market risks (i.e., the risk of loss arising from market changes) to which we are exposed are foreign currency exchange rates, price risk, and interest rate risk.
The assumptions applied in preparing the following qualitative and quantitative disclosures regarding foreign currency exchange rate, price risk and interest rate risk are based upon volatility ranges experienced by us in relevant historical periods, our current knowledge of the marketplace, and our judgment of the probability of future volatility based upon the historical trends and economic conditions of the markets in which we operate.
Foreign Currency
International consolidated sales for the first nine months of fiscal 2026 were 16% of total sales. Operating in markets throughout the world exposes us to movements in currency exchange rates. Currency movements can affect sales in several ways, the foremost being our ability to compete for orders against foreign competitors that base their prices on relatively weaker currencies. Business lost due to competition for orders against competitors using a relatively weaker currency cannot be quantified. In addition, cash can be adversely impacted by the conversion of sales made by us in a foreign currency to U.S. dollars. In the first nine months of fiscal 2026, substantially all sales by us and our wholly-owned subsidiaries, for which we were paid, were denominated in the local currency of the respective subsidiary (U.S. dollars, Chinese RMB or India INR). For the first nine months of fiscal 2026, foreign currency exchange rate fluctuations increased our cash balances by $141 primarily due to the weakening of the U.S. dollar.
We have limited exposure to foreign currency purchases. In the first nine months of fiscal 2026, our purchases in foreign currencies represented approximately 4% of the cost of products sold. At certain times, we may enter into forward foreign currency exchange rate agreements to hedge our exposure against potential unfavorable changes in foreign currency values on significant sales and purchase contracts negotiated in foreign currencies. Forward foreign currency exchange rate contracts were not used in the periods being reported in this Form 10-Q and as of December 31, 2025 and March 31, 2025, we held no forward foreign currency contracts.
Price Risk
Operating in a global market place requires us to compete with other global manufacturers which, in some instances, benefit from lower production costs and more favorable economic conditions, such as lower tariffs. Although we believe that our customers differentiate our products on the basis of our manufacturing quality, engineering experience, and customer service, among other things, such lower production costs and more favorable economic conditions mean that our competitors are able to offer products similar to ours at lower prices. In extreme market downturns, we typically see depressed price levels. Additionally, we have faced, and may continue to face, significant cost inflation, specifically in labor costs, raw materials, tariffs, and other supply chain costs due to increased demand for raw materials and resources caused by the broad disruption of the global supply chain. International conflicts or other geopolitical events, including the on-going Russia and Ukraine war, the Israel-Hamas and Israel-Iran conflicts, the changes in Venezuela, and recent trade-related actions, may further contribute to increased supply chain costs due to shortages in raw materials, increased costs for transportation and energy, disruptions in supply chains, increased tariffs, and heightened inflation. Further escalation of tariffs or geopolitical tensions may also lead to changes to foreign exchange rates and financial markets, any of which may adversely affect our business and supply chain, and consequently our results of operations. For the first nine months of fiscal 2026, we estimate the impact of tariffs on our consolidated financial statements to be approximately $1,000 compared to the prior year. We estimate the range of potential impact of increased tariffs for the full year will be between an incremental $1,000 to $1,500 compared to the prior year.
Interest Rate Risk
In order to fund our strategic growth objectives, including acquisitions, from time to time we may borrow funds under our Revolving Credit Facility that bears interest at a variable rate. As part of our risk management activities, we evaluate the use of interest rate derivatives to add stability to interest expense and to manage our exposure to interest rate movements. As of December 31, 2025,
we had no variable rate debt outstanding on our Revolving Credit Facility and no interest rate derivatives outstanding. See "Debt" in Note 13 to the Condensed Consolidated Financial Statements included in Part I, Item 1 of this Form 10-Q for additional information about our outstanding debt.
Item 4. Controls and Procedures
Conclusion regarding the effectiveness of disclosure controls and procedures
Our Chief Executive Officer (our principal executive officer) and Vice President - Finance and Chief Financial Officer (our principal financial officer) each have evaluated the effectiveness of our disclosure controls and procedures (as defined in Exchange Act Rules 13a-15(e) and 15d-15(e)) as of the end of the period covered by this Form 10-Q. Based on such evaluation, and as of such date, our Chief Executive Officer and Vice President - Finance and Chief Financial Officer concluded that our disclosure controls and procedures were effective in all material respects.
Changes in internal control over financial reporting
There has been no change to our internal control over financial reporting during the quarter covered by this Form 10-Q that has materially affected, or that is reasonably likely to materially affect, our internal control over financial reporting.
PART II - OTHER INFORMATION
Item 1A. Risk Factors
There have been no material changes from the risk factors previously disclosed in Part 1 – Item 1A of the Company’s Form 10-K for the fiscal year ended March 31, 2025.
Item 2. Unregistered Sales of Equity Securities, Use of Proceeds, and Issuer Purchases of Equity Securities
Dividend Policy
Our revolving credit facility with Wells Fargo contains terms that may, under certain circumstances as defined in the agreement, restrict our ability to declare or pay dividends. Any determination by our Board of Directors regarding dividends in the future will depend on a variety of factors, including our future financial performance, organic and inorganic growth opportunities, general economic conditions and financial, competitive, regulatory, and other factors, many of which are beyond our control. We did not pay any dividends during the nine months ended December 31, 2025 or during fiscal 2025 and we currently have no intention to pay dividends for the foreseeable future. There can be no guarantee that we will pay dividends in the future.
Item 6. Exhibits
INDEX OF EXHIBITS
|
|
|
|
|
|
|
|
|
|
(104) |
|
|
Cover Page Interactive Data File embedded within the Inline XBRL document |
|
|
|
|
|
|
|
+ ++ |
Exhibit filed with this report Exhibit furnished with this report |
SIGNATURES
Pursuant to the requirements of the Securities Exchange Act of 1934, the registrant has duly caused this report to be signed on its behalf by the undersigned thereunto duly authorized.
|
|
|
|
|
GRAHAM CORPORATION |
By: |
|
|
/s/ CHRISTOPHER J. THOME |
|
|
|
Christopher J. Thome |
|
|
|
Vice President-Finance, Chief Financial Officer, |
|
|
|
Chief Accounting Officer, and Corporate Secretary |
|
|
|
(On behalf of the Registrant and as Principal Financial Officer) |
|
|
|
|
Date: February 6, 2026