UNITED STATES
SECURITIES AND EXCHANGE COMMISSION
WASHINGTON, D.C. 20549
FORM 10-Q
(Mark One)
|
☒ |
QUARTERLY REPORT PURSUANT TO SECTION 13 OR 15(d) OF THE SECURITIES EXCHANGE ACT OF 1934 |
For the quarterly period ended December 31, 2017
|
☐ |
TRANSITION REPORT PURSUANT TO SECTION 13 OR 15(d) OF THE SECURITIES EXCHANGE ACT OF 1934 |
For the transition period from _____________ to ___________
Commission File Number 1-8462
GRAHAM CORPORATION
(Exact name of registrant as specified in its charter)
|
Delaware |
16-1194720 |
|
(State or other jurisdiction of incorporation or organization) |
(I.R.S. Employer Identification No.) |
|
|
|
|
20 Florence Avenue, Batavia, New York |
14020 |
|
(Address of principal executive offices) |
(Zip Code) |
585-343-2216
(Registrant's telephone number, including area code)
Indicate by check mark whether the registrant (1) has filed all reports required to be filed by Section 13 or 15(d) of the Securities Exchange Act of 1934 during the preceding 12 months (or for such shorter period that the registrant was required to file such reports), and (2) has been subject to such filing requirements for the past 90 days.
Yes ☒ No ☐
Indicate by check mark whether the registrant has submitted electronically and posted on its corporate Web site, if any, every Interactive Data File required to be submitted and posted pursuant to Rule 405 of Regulation S-T during the preceding 12 months (or for such shorter period that the registrant was required to submit and post such files).
Yes ☒ No ☐
Indicate by check mark whether the registrant is a large accelerated filer, an accelerated filer, a non-accelerated filer or a smaller reporting company. See definition of "large accelerated filer," "accelerated filer," "smaller reporting company," and "emerging growth company" in Rule 12b-2 of the Exchange Act.
|
Large accelerated filer |
☐ |
|
Accelerated filer |
☒ |
|
Non-accelerated filer |
☐ |
(Do not check if a smaller reporting company) |
Smaller reporting company |
☐ |
|
Emerging growth company |
☐ |
|
|
|
If an emerging growth company, indicate by check mark if the registrant has elected not to use the extended transition period for complying with any new or revised financial accounting standards provided pursuant to Section 13(a) of the Exchange Act. ☐
Indicate by check mark whether the registrant is a shell company (as defined in Rule 12b-2 of the Exchange Act).
Yes ☐ No ☒
As of January 30, 2018, there were outstanding 9,768,026 shares of the registrant’s common stock, par value $.10 per share.
Graham Corporation and Subsidiaries
Index to Form 10-Q
As of December 31, 2017 and March 31, 2017 and for the Three and Nine-Month Periods Ended December 31, 2017 and 2016
|
|
|
Page |
|
Part I. |
|
|
|
|
|
|
|
Item 1. |
4 |
|
|
|
|
|
|
Item 2. |
Management’s Discussion and Analysis of Financial Condition and Results of Operations |
17 |
|
|
|
|
|
Item 3. |
23 |
|
|
|
|
|
|
Item 4. |
24 |
|
|
|
|
|
|
Part II. |
|
|
|
|
|
|
|
Item 6. |
25 |
|
|
|
|
|
|
26 |
||
|
|
|
|
2
GRAHAM CORPORATION AND SUBSIDIARIES
FORM 10-Q
DECEMBER 31, 2017
PART I – FINANCIAL INFORMATION
3
GRAHAM CORPORATION AND SUBSIDIARIES
CONDENSED CONSOLIDATED STATEMENTS OF OPERATIONS AND RETAINED EARNINGS
(Unaudited)
|
|
|
Three Months Ended |
|
|
Nine Months Ended |
|
||||||||||
|
|
|
December 31, |
|
|
December 31, |
|
||||||||||
|
|
|
2017 |
|
|
2016 |
|
|
2017 |
|
|
2016 |
|
||||
|
|
|
(Amounts in thousands, except per share data) |
|
|
(Amounts in thousands, except per share data) |
|
||||||||||
|
Net sales |
|
$ |
17,281 |
|
|
$ |
22,654 |
|
|
$ |
55,356 |
|
|
$ |
66,145 |
|
|
Cost of products sold |
|
|
13,696 |
|
|
|
16,353 |
|
|
|
43,075 |
|
|
|
50,723 |
|
|
Gross profit |
|
|
3,585 |
|
|
|
6,301 |
|
|
|
12,281 |
|
|
|
15,422 |
|
|
Other expenses and income: |
|
|
|
|
|
|
|
|
|
|
|
|
|
|
|
|
|
Selling, general and administrative |
|
|
4,007 |
|
|
|
3,746 |
|
|
|
11,270 |
|
|
|
10,462 |
|
|
Selling, general and administrative – amortization |
|
|
59 |
|
|
|
58 |
|
|
|
177 |
|
|
|
175 |
|
|
Impairment of goodwill and intangible assets |
|
|
14,816 |
|
|
|
— |
|
|
|
14,816 |
|
|
|
— |
|
|
Restructuring charge |
|
|
— |
|
|
|
— |
|
|
|
316 |
|
|
|
630 |
|
|
Interest income |
|
|
(142 |
) |
|
|
(100 |
) |
|
|
(455 |
) |
|
|
(272 |
) |
|
Interest expense |
|
|
3 |
|
|
|
3 |
|
|
|
8 |
|
|
|
7 |
|
|
Total other expenses and income |
|
|
18,743 |
|
|
|
3,707 |
|
|
|
26,132 |
|
|
|
11,002 |
|
|
(Loss) income before provision for income taxes |
|
|
(15,158 |
) |
|
|
2,594 |
|
|
|
(13,851 |
) |
|
|
4,420 |
|
|
(Benefit) provision for income taxes |
|
|
(3,536 |
) |
|
|
754 |
|
|
|
(3,174 |
) |
|
|
1,198 |
|
|
Net (loss) income |
|
|
(11,622 |
) |
|
|
1,840 |
|
|
|
(10,677 |
) |
|
|
3,222 |
|
|
Retained earnings at beginning of period |
|
|
109,731 |
|
|
|
108,655 |
|
|
|
110,544 |
|
|
|
109,013 |
|
|
Dividends |
|
|
(880 |
) |
|
|
(876 |
) |
|
|
(2,638 |
) |
|
|
(2,616 |
) |
|
Retained earnings at end of period |
|
$ |
97,229 |
|
|
$ |
109,619 |
|
|
$ |
97,229 |
|
|
$ |
109,619 |
|
|
Per share data |
|
|
|
|
|
|
|
|
|
|
|
|
|
|
|
|
|
Basic: |
|
|
|
|
|
|
|
|
|
|
|
|
|
|
|
|
|
Net (loss) income |
|
$ |
(1.19 |
) |
|
$ |
0.19 |
|
|
$ |
(1.09 |
) |
|
$ |
0.33 |
|
|
Diluted: |
|
|
|
|
|
|
|
|
|
|
|
|
|
|
|
|
|
Net (loss) income |
|
$ |
(1.19 |
) |
|
$ |
0.19 |
|
|
$ |
(1.09 |
) |
|
$ |
0.33 |
|
|
Weighted average common shares outstanding: |
|
|
|
|
|
|
|
|
|
|
|
|
|
|
|
|
|
Basic |
|
|
9,768 |
|
|
|
9,727 |
|
|
|
9,762 |
|
|
|
9,709 |
|
|
Diluted |
|
|
9,768 |
|
|
|
9,733 |
|
|
|
9,762 |
|
|
|
9,714 |
|
|
Dividends declared per share |
|
$ |
0.09 |
|
|
$ |
0.09 |
|
|
$ |
0.27 |
|
|
$ |
0.27 |
|
See Notes to Condensed Consolidated Financial Statements.
4
GRAHAM CORPORATION AND SUBSIDIARIES
CONDENSED CONSOLIDATED STATEMENTS OF COMPREHENSIVE (LOSS) INCOME
(Unaudited)
|
|
|
Three Months Ended |
|
|
Nine Months Ended |
|
||||||||||
|
|
|
December 31, |
|
|
December 31, |
|
||||||||||
|
|
|
2017 |
|
|
2016 |
|
|
2017 |
|
|
2016 |
|
||||
|
|
|
(Amounts in thousands) |
|
|
(Amounts in thousands) |
|
||||||||||
|
Net (loss) income |
|
$ |
(11,622 |
) |
|
$ |
1,840 |
|
|
$ |
(10,677 |
) |
|
$ |
3,222 |
|
|
Other comprehensive income: |
|
|
|
|
|
|
|
|
|
|
|
|
|
|
|
|
|
Foreign currency translation adjustment |
|
|
76 |
|
|
|
(135 |
) |
|
|
216 |
|
|
|
(283 |
) |
|
Defined benefit pension and other postretirement plans net of income tax expense (benefit) of $(17) and $123, for the three months ended December 31, 2017 and 2016, respectively, and $169 and $369 for the nine months ended December 31, 2017 and 2016, respectively |
|
|
279 |
|
|
|
225 |
|
|
|
619 |
|
|
|
674 |
|
|
Total other comprehensive income |
|
|
355 |
|
|
|
90 |
|
|
|
835 |
|
|
|
391 |
|
|
Total comprehensive (loss) income |
|
$ |
(11,267 |
) |
|
$ |
1,930 |
|
|
$ |
(9,842 |
) |
|
$ |
3,613 |
|
See Notes to Condensed Consolidated Financial Statements.
5
GRAHAM CORPORATION AND SUBSIDIARIES
CONDENSED CONSOLIDATED BALANCE SHEETS
(Unaudited)
|
|
|
December 31, |
|
|
March 31, |
|
||
|
|
|
2017 |
|
|
2017 |
|
||
|
|
|
(Amounts in thousands, except per share data) |
|
|||||
|
Assets |
|
|
|
|
|
|
|
|
|
Current assets: |
|
|
|
|
|
|
|
|
|
Cash and cash equivalents |
|
$ |
36,159 |
|
|
$ |
39,474 |
|
|
Investments |
|
|
38,023 |
|
|
|
34,000 |
|
|
Trade accounts receivable, net of allowances ($336 and $168 at December 31 and March 31, 2017, respectively) |
|
|
16,555 |
|
|
|
11,483 |
|
|
Unbilled revenue |
|
|
10,709 |
|
|
|
15,842 |
|
|
Inventories |
|
|
8,899 |
|
|
|
9,246 |
|
|
Prepaid expenses and other current assets |
|
|
1,181 |
|
|
|
681 |
|
|
Income taxes receivable |
|
|
1,288 |
|
|
|
— |
|
|
Total current assets |
|
|
112,814 |
|
|
|
110,726 |
|
|
Property, plant and equipment, net |
|
|
16,098 |
|
|
|
17,021 |
|
|
Prepaid pension asset |
|
|
3,110 |
|
|
|
2,340 |
|
|
Goodwill |
|
|
1,222 |
|
|
|
6,938 |
|
|
Permits |
|
|
1,700 |
|
|
|
10,300 |
|
|
Other intangible assets, net |
|
|
3,433 |
|
|
|
4,068 |
|
|
Other assets |
|
|
246 |
|
|
|
177 |
|
|
Total assets |
|
$ |
138,623 |
|
|
$ |
151,570 |
|
|
Liabilities and stockholders’ equity |
|
|
|
|
|
|
|
|
|
Current liabilities: |
|
|
|
|
|
|
|
|
|
Current portion of capital lease obligations |
|
$ |
105 |
|
|
$ |
107 |
|
|
Accounts payable |
|
|
9,386 |
|
|
|
10,295 |
|
|
Accrued compensation |
|
|
4,418 |
|
|
|
5,189 |
|
|
Accrued expenses and other current liabilities |
|
|
2,722 |
|
|
|
3,723 |
|
|
Customer deposits |
|
|
17,814 |
|
|
|
12,407 |
|
|
Income taxes payable |
|
|
— |
|
|
|
317 |
|
|
Total current liabilities |
|
|
34,445 |
|
|
|
32,038 |
|
|
Capital lease obligations |
|
|
67 |
|
|
|
143 |
|
|
Deferred income tax liability |
|
|
736 |
|
|
|
4,051 |
|
|
Accrued pension liability |
|
|
534 |
|
|
|
467 |
|
|
Accrued postretirement benefits |
|
|
780 |
|
|
|
761 |
|
|
Other long-term liabilities |
|
|
126 |
|
|
|
— |
|
|
Total liabilities |
|
|
36,688 |
|
|
|
37,460 |
|
|
Commitments and contingencies (Note 11) |
|
|
|
|
|
|
|
|
|
Stockholders’ equity: |
|
|
|
|
|
|
|
|
|
Preferred stock, $1.00 par value, 500 shares authorized |
|
|
|
|
|
|
|
|
|
Common stock, $.10 par value, 25,500 shares authorized 10,579 and 10,548 shares issued and 9,768 and 9,740 shares outstanding at December 31 and March 31, 2017, respectively |
|
|
1,058 |
|
|
|
1,055 |
|
|
Capital in excess of par value |
|
|
23,573 |
|
|
|
23,176 |
|
|
Retained earnings |
|
|
97,229 |
|
|
|
110,544 |
|
|
Accumulated other comprehensive loss |
|
|
(7,599 |
) |
|
|
(8,434 |
) |
|
Treasury stock (811 and 808 shares at December 31 and March 31, 2017, respectively) |
|
|
(12,326 |
) |
|
|
(12,231 |
) |
|
Total stockholders’ equity |
|
|
101,935 |
|
|
|
114,110 |
|
|
Total liabilities and stockholders’ equity |
|
$ |
138,623 |
|
|
$ |
151,570 |
|
See Notes to Condensed Consolidated Financial Statements.
6
GRAHAM CORPORATION AND SUBSIDIARIES
CONDENSED CONSOLIDATED STATEMENTS OF CASH FLOWS
(Unaudited)
|
|
|
Nine Months Ended |
|
|||||
|
|
|
December 31, |
|
|||||
|
|
|
2017 |
|
|
2016 |
|
||
|
Operating activities: |
|
(Dollar amounts in thousands) |
|
|||||
|
Net (loss) income |
|
$ |
(10,677 |
) |
|
$ |
3,222 |
|
|
Adjustments to reconcile net income to net cash provided by operating activities: |
|
|
|
|
|
|
|
|
|
Depreciation |
|
|
1,490 |
|
|
|
1,571 |
|
|
Amortization |
|
|
177 |
|
|
|
175 |
|
|
Amortization of unrecognized prior service cost and actuarial losses |
|
|
788 |
|
|
|
1,043 |
|
|
Impairment of goodwill and purchased intangible assets |
|
|
14,816 |
|
|
|
— |
|
|
Stock-based compensation expense |
|
|
362 |
|
|
|
433 |
|
|
Loss on disposal or sale of property, plant and equipment |
|
|
1 |
|
|
|
1 |
|
|
Deferred income taxes |
|
|
(3,498 |
) |
|
|
10 |
|
|
(Increase) decrease in operating assets: |
|
|
|
|
|
|
|
|
|
Accounts receivable |
|
|
(5,029 |
) |
|
|
1,126 |
|
|
Unbilled revenue |
|
|
5,170 |
|
|
|
(2,651 |
) |
|
Inventories |
|
|
352 |
|
|
|
1,697 |
|
|
Prepaid expenses and other current and non-current assets |
|
|
(591 |
) |
|
|
(489 |
) |
|
Income taxes receivable |
|
|
(1,605 |
) |
|
|
1,109 |
|
|
Prepaid pension asset |
|
|
(770 |
) |
|
|
— |
|
|
Increase (decrease) in operating liabilities: |
|
|
|
|
|
|
|
|
|
Accounts payable |
|
|
(1,005 |
) |
|
|
(2,173 |
) |
|
Accrued compensation, accrued expenses and other current and non-current liabilities |
|
|
(1,593 |
) |
|
|
(558 |
) |
|
Customer deposits |
|
|
5,400 |
|
|
|
6,699 |
|
|
Long-term portion of accrued compensation, accrued pension liability and accrued postretirement benefits |
|
|
86 |
|
|
|
(508 |
) |
|
Net cash provided by operating activities |
|
|
3,874 |
|
|
|
10,707 |
|
|
Investing activities: |
|
|
|
|
|
|
|
|
|
Purchase of property, plant and equipment |
|
|
(543 |
) |
|
|
(241 |
) |
|
Proceeds from disposal of property, plant and equipment |
|
|
1 |
|
|
|
— |
|
|
Purchase of investments |
|
|
(34,023 |
) |
|
|
(39,000 |
) |
|
Redemption of investments at maturity |
|
|
30,000 |
|
|
|
45,000 |
|
|
Net cash (used) provided by investing activities |
|
|
(4,565 |
) |
|
|
5,759 |
|
|
Financing activities: |
|
|
|
|
|
|
|
|
|
Principal repayments on capital lease obligations |
|
|
(78 |
) |
|
|
(38 |
) |
|
Issuance of common stock |
|
|
— |
|
|
|
79 |
|
|
Dividends paid |
|
|
(2,638 |
) |
|
|
(2,616 |
) |
|
Purchase of treasury stock |
|
|
(119 |
) |
|
|
(29 |
) |
|
Excess tax deficiency on stock awards |
|
|
— |
|
|
|
(26 |
) |
|
Net cash used by financing activities |
|
|
(2,835 |
) |
|
|
(2,630 |
) |
|
Effect of exchange rate changes on cash |
|
|
211 |
|
|
|
(231 |
) |
|
Net (decrease) increase in cash and cash equivalents |
|
|
(3,315 |
) |
|
|
13,605 |
|
|
Cash and cash equivalents at beginning of year |
|
|
39,474 |
|
|
|
24,072 |
|
|
Cash and cash equivalents at end of period |
|
$ |
36,159 |
|
|
$ |
37,677 |
|
See Notes to Condensed Consolidated Financial Statements.
7
GRAHAM CORPORATION AND SUBSIDIARIES
NOTES TO CONDENSED CONSOLIDATED FINANCIAL STATEMENTS
(Unaudited)
(Amounts in thousands, except per share data)
NOTE 1 – BASIS OF PRESENTATION:
Graham Corporation's (the "Company's") Condensed Consolidated Financial Statements include its (i) wholly-owned foreign subsidiary located in Suzhou, China and (ii) wholly-owned domestic subsidiary located in Lapeer, Michigan. The Condensed Consolidated Financial Statements have been prepared in accordance with accounting principles generally accepted in the U.S. ("GAAP") for interim financial information and the instructions to Form 10-Q and Rule 10-01 of Regulation S-X, each as promulgated by the Securities and Exchange Commission. The Company's Condensed Consolidated Financial Statements do not include all information and notes required by GAAP for complete financial statements. The unaudited Condensed Consolidated Balance Sheet as of March 31, 2017 presented herein was derived from the Company’s audited Consolidated Balance Sheet as of March 31, 2017. For additional information, please refer to the consolidated financial statements and notes included in the Company's Annual Report on Form 10-K for the fiscal year ended March 31, 2017 ("fiscal 2017"). In the opinion of management, all adjustments, including normal recurring accruals considered necessary for a fair presentation, have been included in the Company's Condensed Consolidated Financial Statements.
The Company's results of operations and cash flows for the three and nine months ended December 31, 2017 are not necessarily indicative of the results that may be expected for the current fiscal year, which ends March 31, 2018 ("fiscal 2018").
NOTE 2 – REVENUE RECOGNITION:
The Company recognizes revenue on all contracts with a planned manufacturing process in excess of four weeks (which approximates 575 direct labor hours) using the percentage-of-completion method. The majority of the Company's revenue is recognized under this methodology. The Company has established the systems and procedures essential to developing the estimates required to account for contracts using the percentage-of-completion method. The percentage-of-completion method is determined by comparing actual labor incurred to a specific date to management's estimate of the total labor to be incurred on each contract or completion of operational milestones assigned to each contract. Contracts in progress are reviewed monthly by management, and sales and earnings are adjusted in current accounting periods based on revisions in the contract value and estimated costs at completion. Losses on contracts are recognized immediately when evident to management.
Revenue on contracts not accounted for using the percentage-of-completion method is recognized utilizing the completed contract method. The majority of the Company's contracts (as opposed to revenue) have a planned manufacturing process of less than four weeks and the results reported under this method do not vary materially from the percentage-of-completion method. The Company recognizes revenue and all related costs on these contracts upon substantial completion or shipment to the customer. Substantial completion is consistently defined as at least 95% complete with regard to direct labor hours. Customer acceptance is generally required throughout the construction process and the Company has no further material obligations under its contracts after the revenue is recognized.
Receivables billed but not paid under retainage provisions in the Company’s customer contracts were $1,141 and $971 at December 31, 2017 and March 31, 2017, respectively.
NOTE 3 – INVESTMENTS:
Investments consist of certificates of deposits with financial institutions. All investments have original maturities of greater than three months and less than one year and are classified as held-to-maturity, as the Company believes it has the intent and ability to hold the securities to maturity. Investments are stated at amortized cost which approximates fair value. All investments held by the Company at December 31, 2017 are scheduled to mature on or before May 31, 2018.
8
NOTE 4 – INVENTORIES:
Inventories are stated at the lower of cost or market, using the average cost method. Unbilled revenue in the Condensed Consolidated Balance Sheets represents revenue recognized that has not been billed to customers on contracts accounted for on the percentage-of-completion method. For contracts accounted for on the percentage-of-completion method, progress payments are netted against unbilled revenue to the extent the payment is less than the unbilled revenue for the applicable contract. Progress payments exceeding unbilled revenue are netted against inventory to the extent the payment is less than or equal to the inventory balance relating to the applicable contract, and the excess is presented as customer deposits in the Condensed Consolidated Balance Sheets.
Major classifications of inventories are as follows:
|
|
|
December 31, |
|
|
March 31, |
|
||
|
|
|
2017 |
|
|
2017 |
|
||
|
Raw materials and supplies |
|
$ |
3,034 |
|
|
$ |
3,016 |
|
|
Work in process |
|
|
9,334 |
|
|
|
12,573 |
|
|
Finished products |
|
|
935 |
|
|
|
891 |
|
|
|
|
|
13,303 |
|
|
|
16,480 |
|
|
Less - progress payments |
|
|
4,404 |
|
|
|
7,234 |
|
|
Total |
|
$ |
8,899 |
|
|
$ |
9,246 |
|
NOTE 5 – INTANGIBLE ASSETS:
Intangible assets are comprised of the following:
|
|
|
Gross Carrying Amount |
|
|
Accumulated Amortization |
|
|
Impairment Loss |
|
|
Net Carrying Amount |
|
||||
|
At December 31, 2017 |
|
|
|
|
|
|
|
|
|
|
|
|
|
|
|
|
|
Intangibles subject to amortization: |
|
|
|
|
|
|
|
|
|
|
|
|
|
|
|
|
|
Customer relationships |
|
$ |
2,700 |
|
|
$ |
1,267 |
|
|
$ |
— |
|
|
$ |
1,433 |
|
|
Intangibles not subject to amortization: |
|
|
|
|
|
|
|
|
|
|
|
|
|
|
|
|
|
Permits |
|
$ |
10,300 |
|
|
$ |
— |
|
|
$ |
8,600 |
|
|
$ |
1,700 |
|
|
Tradename |
|
|
2,500 |
|
|
|
— |
|
|
|
500 |
|
|
|
2,000 |
|
|
|
|
$ |
12,800 |
|
|
$ |
— |
|
|
$ |
9,100 |
|
|
$ |
3,700 |
|
|
At March 31, 2017 |
|
|
|
|
|
|
|
|
|
|
|
|
|
|
|
|
|
Intangibles subject to amortization: |
|
|
|
|
|
|
|
|
|
|
|
|
|
|
|
|
|
Customer relationships |
|
$ |
2,700 |
|
|
$ |
1,132 |
|
|
$ |
— |
|
|
$ |
1,568 |
|
|
Intangibles not subject to amortization: |
|
|
|
|
|
|
|
|
|
|
|
|
|
|
|
|
|
Permits |
|
$ |
10,300 |
|
|
$ |
— |
|
|
$ |
— |
|
|
$ |
10,300 |
|
|
Tradename |
|
|
2,500 |
|
|
|
— |
|
|
|
— |
|
|
|
2,500 |
|
|
|
|
$ |
12,800 |
|
|
$ |
— |
|
|
$ |
— |
|
|
$ |
12,800 |
|
Finite-lived intangible assets are amortized on a straight-line basis over the estimated useful lives. Intangible amortization expense for each of the three-month periods ended December 31, 2017 and 2016 was $45. Intangible amortization expense for each of the nine-month periods ended December 31, 2017 and 2016 was $135. As of December 31, 2017, amortization expense is estimated to be $45 for the remainder of fiscal 2018 and $180 in each of the fiscal years ending March 31, 2019, 2020, 2021 and 2022.
During the third quarter of fiscal 2018, the Company performed its annual goodwill and intangible asset impairment review. The Company assesses impairment by comparing the fair value of its reporting units and intangible assets to their related carrying value. Accounting Standards Update No. 2015-07, “Fair Value Measurement (Topic 820), establishes a hierarchy for inputs used in measuring fair value that maximizes the use of observable inputs and minimizes the use of unobservable inputs by requiring that the most observable inputs be used when available. The hierarchy is broken down into three levels based on the reliability of inputs as follows:
Level 1 – Valuations based on quoted prices in active markets for identical assets of liabilities that the Company has the ability to access. Since valuations are based on quoted prices that are readily and regularly available in an active market, valuation of these products does not entail a significant degree of judgment.
Level 2 – Valuations determined from quoted prices for similar assets of liabilities in active markets, quoted prices for identical instruments in markets that are not active or by model-based techniques in which all significant inputs are observable in the market.
9
Level 3 – Valuations based on inputs that are unobservable and significant to the overall fair value measurement. The degree of judgment exercised in determining fair value is greatest for instruments categorized in Level 3.
The Company estimated the fair value of intangible assets and goodwill of its commercial nuclear power business related to the December 2010 acquisition of Energy Steel & Supply Co. (“Energy Steel”) using the income approach. Under the income approach, the fair value of the business is calculated based on the present value of estimated future cash flows. Cash flow projections are based on management’s estimates of revenue growth rates and operating margins, taking into consideration industry and market conditions. The discount rate used is based on a weighted average cost of capital adjusted for the relevant risk associated with the characteristics of the business and the projected cash flows. The inputs utilized in the analyses are classified as Level 3 inputs within the fair value hierarchy outlined above. The impairment review indicated that the fair value of the permits, tradename and goodwill of the business were substantially lower than the carrying value due to reduced investment from the U.S. nuclear power market, the strength of the Energy Steel brand relative to larger more vertically integrated suppliers, and the bankruptcy of Westinghouse Electric Company which resulted in the stoppage of work at the Summer, SC nuclear facility. As a result, in the third quarter of fiscal 2018 the Company recorded impairment losses of $8,600, $500, and $5,716 for permits, tradename and goodwill, respectively.
NOTE 6 – STOCK-BASED COMPENSATION:
The Amended and Restated 2000 Graham Corporation Incentive Plan to Increase Shareholder Value, as approved by the Company’s stockholders at the Annual Meeting on July 28, 2016, provides for the issuance of up to 1,375 shares of common stock in connection with grants of incentive stock options, non-qualified stock options, stock awards and performance awards to officers, key employees and outside directors: provided, however, that no more than 467 shares of common stock may be used for awards other than stock options. Stock options may be granted at prices not less than the fair market value at the date of grant and expire no later than ten years after the date of grant.
No restricted stock awards were granted in the three-month periods ended December 31, 2017 and 2016. Restricted stock awards granted in the nine-month periods ended December 31, 2017 and 2016 were 59 and 82, respectively. Restricted shares of 30 and 43 granted to officers in fiscal 2018 and fiscal 2017, respectively, vest 100% on the third anniversary of the grant date subject to the satisfaction of the performance metrics for the applicable three-year period. Restricted shares of 22 and 31 granted to officers and key employees in fiscal 2018 and fiscal 2017, respectively, vest 33⅓% per year over a three-year term. Restricted shares of 7 and 8 granted to directors in fiscal 2018 and fiscal 2017, respectively, vest 100% on the first year anniversary of the grant date. No stock option awards were granted in the three-month or nine-month periods ended December 31, 2017 and 2016 December 31, 2017 and 2016.
During the three months ended December 31, 2017 and 2016, the Company recognized stock-based compensation costs related to stock option and restricted stock awards of $213 and $200, respectively. The income tax benefit recognized related to stock-based compensation was $24 and $70 for the three months ended December 31, 2017 and 2016, respectively. During the nine months ended December 31, 2017 and 2016, the Company recognized stock-based compensation costs related to stock option and restricted stock awards of $362 and $427, respectively. The income tax benefit recognized related to stock-based compensation was $77 and $151 for the nine months ended December 31, 2017 and 2016, respectively.
The Company has an Employee Stock Purchase Plan (the "ESPP"), which allows eligible employees to purchase shares of the Company's common stock at a discount of up to 15% of its fair market value on the (i) last, (ii) first or (iii) lower of the last or first day of the six-month offering period. A total of 200 shares of common stock may be purchased under the ESPP. In each of the three months ended December 31, 2017 and 2016, the Company recognized stock-based compensation costs of $0 related to the ESPP and $0 of related tax benefits. During the nine months ended December 31, 2017 and 2016, the Company recognized stock-based compensation costs of $0 and $6, respectively, related to the ESPP and $0 and $2, respectively, of related tax benefits.
10
NOTE 7 – (LOSS) INCOME PER SHARE:
Basic (loss) income per share is computed by dividing net (loss) income by the weighted average number of common shares outstanding for the period. Diluted (loss) income per share is calculated by dividing net (loss) income by the weighted average number of common shares outstanding and, when applicable, potential common shares outstanding during the period. A reconciliation of the numerators and denominators of basic and diluted (loss) income per share is presented below:
|
|
|
Three Months Ended |
|
|
Nine Months Ended |
|
||||||||||
|
|
|
December 31, |
|
|
December 31, |
|
||||||||||
|
|
|
2017 |
|
|
2016 |
|
|
2017 |
|
|
2016 |
|
||||
|
Basic (loss) income per share |
|
|
|
|
|
|
|
|
|
|
|
|
|
|
|
|
|
Numerator: |
|
|
|
|
|
|
|
|
|
|
|
|
|
|
|
|
|
Net (loss) income |
|
$ |
(11,622 |
) |
|
$ |
1,840 |
|
|
$ |
(10,677 |
) |
|
$ |
3,222 |
|
|
Denominator: |
|
|
|
|
|
|
|
|
|
|
|
|
|
|
|
|
|
Weighted average common shares outstanding |
|
|
9,768 |
|
|
|
9,727 |
|
|
|
9,762 |
|
|
|
9,709 |
|
|
Basic (loss) income per share |
|
$ |
(1.19 |
) |
|
$ |
.19 |
|
|
$ |
(1.09 |
) |
|
$ |
.33 |
|
|
Diluted income per share |
|
|
|
|
|
|
|
|
|
|
|
|
|
|
|
|
|
Numerator: |
|
|
|
|
|
|
|
|
|
|
|
|
|
|
|
|
|
Net (loss) income |
|
$ |
(11,622 |
) |
|
$ |
1,840 |
|
|
$ |
(10,677 |
) |
|
$ |
3,222 |
|
|
Denominator: |
|
|
|
|
|
|
|
|
|
|
|
|
|
|
|
|
|
Weighted average common shares outstanding |
|
|
9,768 |
|
|
|
9,727 |
|
|
|
9,762 |
|
|
|
9,709 |
|
|
Stock options outstanding |
|
|
— |
|
|
|
6 |
|
|
|
— |
|
|
|
5 |
|
|
Weighted average common and potential common shares outstanding |
|
|
9,768 |
|
|
|
9,733 |
|
|
|
9,762 |
|
|
|
9,714 |
|
|
Diluted (loss) income per share |
|
$ |
(1.19 |
) |
|
$ |
.19 |
|
|
$ |
(1.09 |
) |
|
$ |
.33 |
|
None of the options to purchase shares of common stock which totaled 69 were included in the computation of diluted loss per share for the three and nine months ended December 31, 2017 as the effect would be anti-dilutive due to the net loss in the periods. Options to purchase a total of 16 shares of common stock were outstanding at December 31, 2016 but were not included in the above computation of diluted income per share in the three and nine-month periods ended December 31, 2016 given their exercise prices as they would not be dilutive upon issuance.
NOTE 8 – PRODUCT WARRANTY LIABILITY:
The reconciliation of the changes in the product warranty liability is as follows:
|
|
|
Three Months Ended |
|
|
Nine Months Ended |
|
||||||||||
|
|
|
December 31, |
|
|
December 31, |
|
||||||||||
|
|
|
2017 |
|
|
2016 |
|
|
2017 |
|
|
2016 |
|
||||
|
Balance at beginning of period |
|
$ |
301 |
|
|
$ |
582 |
|
|
$ |
538 |
|
|
$ |
686 |
|
|
Expense (income) for product warranties |
|
|
22 |
|
|
|
(81 |
) |
|
|
(59 |
) |
|
|
31 |
|
|
Product warranty claims paid |
|
|
(22 |
) |
|
|
(4 |
) |
|
|
(178 |
) |
|
|
(220 |
) |
|
Balance at end of period |
|
$ |
301 |
|
|
$ |
497 |
|
|
$ |
301 |
|
|
$ |
497 |
|
Income of $59 for product warranties in the nine months ended December 31, 2017 and the income of $81 in the three months ended December 31, 2016 resulted from the reversal of provisions made that were no longer required due to lower claims experience.
The product warranty liability is included in the line item "Accrued expenses and other current liabilities" in the Condensed Consolidated Balance Sheets.
11
Interest paid was $8 and $7 in the nine-month periods ended December 31, 2017 and 2016. Income taxes paid for the nine months ended December 31, 2017 and 2016 were $1,801 and $104, respectively.
In the nine months ended December 31, 2017 and 2016, non-cash activities included the issuance of treasury stock valued at $63 and $107, respectively, to the Company’s Employee Stock Purchase Plan.
At December 31 2017 and 2016, respectively, there were $29 and $31 of capital purchases that were recorded in accounts payable and are not included in the caption "Purchase of property, plant and equipment" in the Condensed Consolidated Statements of Cash Flows.
NOTE 10 – EMPLOYEE BENEFIT PLANS:
The components of pension cost are as follows:
|
|
|
Three Months Ended |
|
|
Nine Months Ended |
|
||||||||||
|
|
|
December 31, |
|
|
December 31, |
|
||||||||||
|
|
|
2017 |
|
|
2016 |
|
|
2017 |
|
|
2016 |
|
||||
|
Service cost |
|
$ |
149 |
|
|
$ |
151 |
|
|
$ |
448 |
|
|
$ |
451 |
|
|
Interest cost |
|
|
356 |
|
|
|
362 |
|
|
|
1,067 |
|
|
|
1,087 |
|
|
Expected return on assets |
|
|
(743 |
) |
|
|
(718 |
) |
|
|
(2,232 |
) |
|
|
(2,155 |
) |
|
Amortization of actuarial loss |
|
|
253 |
|
|
|
337 |
|
|
|
760 |
|
|
|
1,013 |
|
|
Net pension cost |
|
$ |
15 |
|
|
$ |
132 |
|
|
$ |
43 |
|
|
$ |
396 |
|
The Company made contributions to its defined benefit pension plan during the nine months ended December 31, 2017 of $52 and does not expect to make any contributions to the plan for the balance of fiscal 2018.
The components of the postretirement benefit cost are as follows:
|
|
|
Three Months Ended |
|
|
Nine Months Ended |
|
||||||||||
|
|
|
December 31, |
|
|
December 31, |
|
||||||||||
|
|
|
2017 |
|
|
2016 |
|
|
2017 |
|
|
2016 |
|
||||
|
Interest cost |
|
$ |
6 |
|
|
$ |
5 |
|
|
$ |
19 |
|
|
$ |
19 |
|
|
Amortization of actuarial loss |
|
|
9 |
|
|
|
11 |
|
|
|
28 |
|
|
|
30 |
|
|
Net postretirement benefit cost |
|
$ |
15 |
|
|
$ |
16 |
|
|
$ |
47 |
|
|
$ |
49 |
|
The Company paid no benefits related to its postretirement benefit plan during the nine months ended December 31, 2017. The Company expects to pay benefits of approximately $83 for the balance of fiscal 2018.
The Company self-funds the medical insurance coverage it provides to its U.S. based employees. The Company maintains a stop loss insurance policy in order to limit its exposure to claims. The liability of $134 and $174 on December 31, 2017 and March 31, 2017, respectively, related to the self-insured medical plan is primarily based upon claim history and is included in the caption “Accrued compensation” as a current liability in the Condensed Consolidated Balance Sheets.
NOTE 11 – COMMITMENTS AND CONTINGENCIES:
The Company has been named as a defendant in lawsuits alleging personal injury from exposure to asbestos allegedly contained in, or accompanying, products made by the Company. The Company is a co-defendant with numerous other defendants in these lawsuits and intends to vigorously defend itself against these claims. The claims in the Company’s current lawsuits are similar to those made in previous asbestos-related suits that named the Company as defendant, which either were dismissed when it was shown that the Company had not supplied products to the plaintiffs’ places of work or were settled for immaterial amounts.
As of December 31, 2017, the Company was subject to the claims noted above, as well as other legal proceedings and potential claims that have arisen in the ordinary course of business.
12
Although the outcome of the lawsuits, legal proceedings or potential claims to which the Company is, or may become, a party to cannot be determined and an estimate of the reasonably possible loss or range of loss cannot be made, management does not believe that the outcomes, either individually or in the aggregate, will have a material effect on the Company’s results of operations, financial position or cash flows.
NOTE 12 – INCOME TAXES:
The Company files federal and state income tax returns in several domestic and international jurisdictions. In most tax jurisdictions, returns are subject to examination by the relevant tax authorities for a number of years after the returns have been filed. The Company is subject to U.S. federal examination for the tax years 2015 through 2017 and examination in state tax jurisdictions for the tax years 2013 through 2017. The Company is subject to examination in the People’s Republic of China for tax years 2014 through 2016.
There was no liability for unrecognized tax benefits at either December 31, 2017 or March 31, 2017.
On December 22, 2017, the Tax Cuts and Jobs Act (the “Tax Act”) was signed into law. The Tax Act, which is effective on January 1, 2018, significantly revises the U.S. tax code by, among other changes, lowering the corporate income tax rate from 35% to 21%, requiring a one-time transition tax on accumulated foreign earnings of certain foreign subsidiaries that were previously tax deferred and creating new taxes on certain foreign sourced earnings. At December 31, 2017, the Company has not completed its accounting for the tax effects of the Tax Act; however, the Company has made a reasonable estimate of the effects on its existing deferred tax balances and the one-time transition tax.
The Company remeasured certain U.S. deferred tax assets and liabilities based on the rates at which they are expected to reverse in the future, which is generally 21%, and provisionally recorded an income tax benefit of $1,575 related to such remeasurement in the third quarter of fiscal 2018. The Company is still analyzing certain aspects of the Tax Act and refining its calculations, which could potentially affect the measurement of these balances or potentially give rise to new deferred tax amounts.
The one-time transition tax is based on the total post-1986 earnings and profits (“E&P”) of our foreign subsidiary that has previously been deferred from U.S. income taxes. The Company recorded a provisional amount for its one-time transition liability of its foreign subsidiary resulting in additional income tax expense of $137 in the third quarter of fiscal 2018. The Company has not yet completed its calculation of the total post-1986 foreign E&P for the foreign subsidiary. The transition tax is based in part on the amount of those earnings held in cash and other specified assets. The amount may change when the Company finalizes the calculation of post-1986 foreign E&P previously deferred from U.S. federal taxation and finalize the amounts held in cash or other specified assets.
NOTE 13 – CHANGES IN ACCUMULATED OTHER COMPREHENSIVE LOSS:
The changes in accumulated other comprehensive loss by component for the nine months ended December 31, 2017 and 2016 are as follows:
|
|
|
Pension and Other Postretirement Benefit Items |
|
|
Foreign Currency Items |
|
|
Total |
|
|||
|
Balance at April 1, 2017 |
|
$ |
(8,439 |
) |
|
$ |
5 |
|
|
$ |
(8,434 |
) |
|
Other comprehensive income before reclassifications |
|
|
— |
|
|
|
216 |
|
|
|
216 |
|
|
Amounts reclassified from accumulated other comprehensive loss |
|
|
619 |
|
|
|
— |
|
|
|
619 |
|
|
Net current-period other comprehensive income |
|
|
619 |
|
|
|
216 |
|
|
|
835 |
|
|
Balance at December 31, 2017 |
|
$ |
(7,820 |
) |
|
$ |
221 |
|
|
$ |
(7,599 |
) |
13
|
|
|
Pension and Other Postretirement Benefit Items |
|
|
Foreign Currency Items |
|
|
Total |
|
|||
|
Balance at April 1, 2016 |
|
$ |
(10,932 |
) |
|
$ |
256 |
|
|
$ |
(10,676 |
) |
|
Other comprehensive income before reclassifications |
|
|
— |
|
|
|
(283 |
) |
|
|
(283 |
) |
|
Amounts reclassified from accumulated other comprehensive loss |
|
|
674 |
|
|
|
— |
|
|
|
674 |
|
|
Net current-period other comprehensive income |
|
|
674 |
|
|
|
(283 |
) |
|
|
391 |
|
|
Balance at December 31, 2016 |
|
$ |
(10,258 |
) |
|
$ |
(27 |
) |
|
$ |
(10,285 |
) |
The reclassifications out of accumulated other comprehensive loss by component for the three and nine months ended December 31, 2017 and 2016 are as follows:
|
Details about Accumulated Other Comprehensive Loss Components |
|
Amount Reclassified from Accumulated Other Comprehensive Loss |
|
|
|
Affected Line Item in the Condensed Consolidated Statements of Income and Retained Earnings |
||||||
|
|
|
Three Months Ended |
|
|
|
|
||||||
|
|
|
December 31, |
|
|
|
|
||||||
|
|
|
2017 |
|
|
|
2016 |
|
|
|
|
||
|
Pension and other postretirement benefit items: |
|
|
|
|
|
|
|
|
|
|
|
|
|
Amortization of actuarial loss |
|
$ |
(262 |
) |
(1) |
|
$ |
(348 |
) |
(1) |
|
Income before provision for income taxes |
|
|
|
|
17 |
|
|
|
|
(123 |
) |
|
|
Provision for income taxes |
|
|
|
$ |
(279 |
) |
|
|
$ |
(225 |
) |
|
|
Net income |
|
Details about Accumulated Other Comprehensive Loss Components |
|
Amount Reclassified from Accumulated Other Comprehensive Loss |
|
|
|
Affected Line Item in the Condensed Consolidated Statements of Income and Retained Earnings |
||||||
|
|
|
Nine Months Ended |
|
|
|
|
||||||
|
|
|
December 31, |
|
|
|
|
||||||
|
|
|
2017 |
|
|
|
2016 |
|
|
|
|
||
|
Pension and other postretirement benefit items: |
|
|
|
|
|
|
|
|
|
|
|
|
|
Amortization of actuarial loss |
|
$ |
(788 |
) |
(1) |
|
$ |
(1,043 |
) |
(1) |
|
Income before provision for income taxes |
|
|
|
|
(169 |
) |
|
|
|
(369 |
) |
|
|
Provision for income taxes |
|
|
|
$ |
(619 |
) |
|
|
$ |
(674 |
) |
|
|
Net income |
|
(1) |
These accumulated other comprehensive loss components are included within the computation of pension and other postretirement benefit costs. See Note 10. |
NOTE 14 – RESTRUCTURING CHARGE:
In each of the second quarter of fiscal 2018 and the first half of fiscal 2017, the Company’s workforce was aligned with market conditions by reducing the number of management, office and manufacturing positions. As a result, restructuring charges of $316 and $630 were recognized in the nine months ended December 31, 2017 and 2016, respectively. The restructuring charges included severance and related employee benefit costs. The charges are included in the caption “Restructuring Charge” in the Condensed Consolidated Statements of Income and Retained Earnings. The reconciliation of the changes in the restructuring reserve is as follows:
|
|
|
Nine Months Ended |
|
|
Nine Months Ended |
|
||
|
|
|
December 31, |
|
|
December 31, |
|
||
|
|
|
2017 |
|
|
2016 |
|
||
|
Balance at beginning of period |
|
$ |
120 |
|
|
$ |
74 |
|
|
Expense for restructuring |
|
|
316 |
|
|
|
630 |
|
|
Amounts paid for restructuring |
|
|
(336 |
) |
|
|
(549 |
) |
|
Balance at end of period |
|
$ |
100 |
|
|
$ |
155 |
|
14
The liability of $100 and $120 at December 31, 2017 and March 31, 2017 respectively, is included in the caption “Accrued Compensation” in the Condensed Consolidated Balance Sheets.
NOTE 15 – ACCOUNTING AND REPORTING CHANGES:
In the normal course of business, management evaluates all new accounting pronouncements issued by the Financial Accounting Standards Board (“FASB”), the Securities and Exchange Commission, the Emerging Issues Task Force, the American Institute of Certified Public Accountants or any other authoritative accounting bodies to determine the potential impact they may have on the Company's consolidated financial statements.
In May 2014, the FASB issued Accounting Standards Update ("ASU") 2014-09, "Revenue from Contracts with Customers." This guidance establishes principles for reporting information about the nature, amount, timing and uncertainty of revenue and cash flows arising from a company’s contracts with customers. The guidance requires companies to apply a five-step model when recognizing revenue to depict the transfer of promised goods or services to customers in an amount that reflects the consideration to which the company expects to be entitled in exchange for those goods and services. The guidance also includes a comprehensive set of disclosure requirements regarding revenue recognition. The guidance allows two methods of adoption: (1) a full retrospective approach where historical financial information is presented in accordance with the new standard and (2) a modified retrospective approach where the guidance is applied to the most current period presented in the financial statements. In August 2015, the FASB issued ASU No 2015-14 "Revenue from Contracts with Customers: Deferral of the Effective Date," which deferred the effective date of ASU 2014-09 to annual reporting periods beginning after December 15, 2017, with earlier application permitted as of annual reporting periods beginning after December 15, 2016. In March 2016, the FASB issued ASU No. 2016-08, "Revenue from Contracts with Customers (Topic 606): Principal versus Agent Considerations (Reporting Revenue Gross versus Net)," to clarify the implementation guidance on principal versus agent. In April 2016, the FASB issued ASU No. 2016-10, "Revenue from Contracts with Customers (Topic 606): Identifying Performance Obligations and Licensing," which clarifies the identifying performance obligations and licensing implementation guidance. In May 2016, the FASB issued ASU No. 2016-12, "Revenue from Contracts with Customers (Topic 606): Narrow Scope Improvements and Practical Expedients," which clarifies the implementation guidance related to collectability, presentation of sales tax, noncash consideration, contract modifications and completed contracts at transition. The Company plans to adopt these standards using the modified retrospective approach in the first quarter of its fiscal year ending March 31, 2019. The Company has developed a project plan and is currently reviewing its contracts and evaluating the impact of the guidance on its revenue. The Company currently believes that the most significant impact of adopting the guidance will be the timing of revenue recognition. The Company believes that revenue on the majority of its contracts will continue to be recognized upon shipment while revenue on its larger contracts are expected to be recognized over time as these contracts meet specific criteria established in the new standards. The Company is in the process of implementing changes to its business processes, systems and controls to support the recognition and disclosure requirements under the new guidance. See Note 2 for a description of the Company’s current revenue recognition policy.
In July 2015, the FASB issued ASU No. 2015-11, "Simplifying the Measurement of Inventory," which simplifies the subsequent measurement of inventory by requiring inventory to be measured at the lower of cost and net realizable value. Net realizable value is the estimated selling prices in the ordinary course of business, less reasonably predictable costs of completion, disposal, and transportation. This ASU is effective for public business entities for fiscal years beginning after December 15, 2016, and interim periods within those fiscal years. The Company adopted the new guidance in the first quarter of fiscal 2018. The adoption of this ASU did not have a material impact on the Company’s Consolidated Financial Statements.
In February 2016, the FASB issued ASU No. 2016-02, "Leases (Topic 842)", which requires companies to recognize all leases as assets and liabilities on the consolidated balance sheet. This ASU retains a distinction between finance leases and operating leases, and the classification criteria for distinguishing between finance leases and operating leases are substantially similar to the classification criteria for distinguishing between capital leases and operating leases in the current accounting guidance. As a result, the effect of leases on the consolidated statement of comprehensive income and the consolidated statement of cash flows is largely unchanged from previous generally accepted accounting principles. The amendments in this ASU are effective for fiscal years beginning after December 15, 2018, including interim periods within those fiscal years. Earlier application is permitted. The Company believes the adoption of this ASU may have a material impact on its assets and liabilities due to the addition of right-of-use assets and lease liabilities to its Consolidated Balance Sheet, however, it does not expect the guidance to have a material impact on its Consolidated Statement of Income or Consolidated Statement of Cash Flows.
In March 2016, the FASB issued ASU 2016-09, "Compensation—Stock Compensation (Topic 718): Improvements to Employee Share-Based Payment Accounting." ASU 2016-09 changes how companies account for certain aspects of share-based payment awards to employees, including the accounting for income taxes, forfeitures and statutory tax withholding requirements, as well as classification in the statement of cash flows. ASU 2016-09 is effective for annual periods beginning after December 15, 2016, including interim periods within those annual periods. The Company adopted the new guidance in the first quarter of fiscal 2018. The adoption of this ASU did not have a material impact on the Company’s Consolidated Financial Statements.
15
In August 2016, the FASB issued ASU No. 2016-15, "Statement of Cash Flows (Topic 230)", which clarifies the presentation and classification of eight specific issues on the cash flow statement. This ASU is effective for public businesses for fiscal years beginning after December 15, 2017, and interim periods within those fiscal years. The Company does not expect the adoption of this ASU will have a material effect on its Consolidated Financial Statements.
In March 2017, the FASB issued ASU No. 2017-07, "Compensation-Retirement Benefits (Topic 715)", which amended its guidance related to the presentation of net periodic pension cost and net periodic postretirement benefit cost. The amended guidance requires the service cost component be disaggregated from the other components of net benefit cost. The service cost component of expense is required to be reported in the income statement in the same line item as other compensation costs within income from operations. The other components of net benefit cost are required to be presented separately from the service cost component outside of income from operations. This ASU is effective for public businesses for fiscal years beginning after December 15, 2017, and interim periods within those fiscal years. The Company is currently evaluating the impact that the adoption of this ASU will have on its Consolidated Financial Statements.
Management does not expect any other recently issued accounting pronouncements, which have not already been adopted, to have a material impact on the Company's consolidated financial statements.
16
Item 2.Management’s Discussion and Analysis of Financial Condition and Results of Operations
(Dollar amounts in thousands, except per share data)
Overview
We are a global business that designs, manufactures and sells critical equipment for the energy, defense and chemical/petrochemical industries. Our energy markets include oil refining, cogeneration, nuclear and alternative power. For the defense industry, our equipment is used in nuclear propulsion power systems for the U.S. Navy. For the chemical and petrochemical industries, our equipment is used in fertilizer, ethylene, methanol and downstream chemical facilities.
Graham’s global brand is built upon world-renowned engineering expertise in vacuum and heat transfer technology, responsive and flexible service and high quality standards. We design and manufacture custom-engineered ejectors, vacuum pumping systems, surface condensers and vacuum systems. We are also a leading nuclear code accredited fabrication and specialty machining company. We supply components used inside reactor vessels and outside containment vessels of nuclear power facilities. Our equipment can also be found in other diverse applications such as metal refining, pulp and paper processing, water heating, refrigeration, desalination, food processing, pharmaceutical, and heating, ventilating and air conditioning.
Our corporate headquarters are located in Batavia, New York. We have production facilities co-located with our headquarters in Batavia and also at our wholly-owned subsidiary, Energy Steel & Supply Co. ("Energy Steel"), located in Lapeer, Michigan. We also have a wholly-owned foreign subsidiary, Graham Vacuum and Heat Transfer Technology (Suzhou) Co., Ltd. ("GVHTT"), located in Suzhou, China. GVHTT provides sales and engineering support for us in the People’s Republic of China and management oversight throughout Southeast Asia.
Our current fiscal year (which we refer to as “fiscal 2018”) ends March 31, 2018.
Highlights
Highlights for the three and nine months ended December 31, 2017 include:
|
|
• |
Net sales for the third quarter of fiscal 2018 were $17,281, down 24% compared with $22,654 for the third quarter of the fiscal year ended March 31, 2017 (we refer to the fiscal year ended March 31, 2017 as "fiscal 2017"). Net sales for the first nine months of fiscal 2018 were $55,356, down 16% compared with net sales of $66,145 for the first nine months of fiscal 2017. |
|
|
• |
Net (loss) and (loss) per diluted share for the third quarter of fiscal 2018 were ($11,622) and ($1.19), respectively. Excluding the non-cash impairment and other charges related to the commercial nuclear power business as well as the impact of the Tax Cuts and Jobs Act (P.L. 115-97) (the “Tax Act”), net income and income per diluted share were ($1) and $0.00, respectively, compared with $1,840 and $0.19, respectively, for the third quarter of fiscal 2017. Net (loss) and (loss) per diluted share for the first nine months of fiscal 2018 were ($10,677) and ($1.09), respectively. Excluding the impairment and other charges related to our commercial nuclear power business, the impact of the Tax Act change, as well as restructuring charges in each year, net income and income per diluted share for the first nine months of fiscal 2018 were $1,168 and $0.12, respectively, compared with net income of $3,222 and income per diluted share of $0.33 for the first nine months of fiscal 2017. |
|
|
• |
Orders booked in the third quarter of fiscal 2018 were $40,528, up 129% compared with the third quarter of fiscal 2017 when orders were $17,699. Orders booked in the first nine months of fiscal 2018 were $68,679, up 20% compared with the first nine months of fiscal 2017, when orders were $57,123. |
|
|
• |
Backlog was $96,246 at December 31, 2017, compared with $72,981 at September 30, 2017 and $82,590 at March 31, 2017. |
|
|
• |
Gross profit margin and operating margin for the third quarter of fiscal 2018 were 21% and (89%) respectively, compared with 28% and 11%, respectively, for the third quarter of fiscal 2017. Gross profit margin and operating margin for the first nine months of fiscal 2018 were 22% and (26%) compared with 23% and 6%, respectively, for the first nine months of fiscal 2017. Excluding the impairment and other charges related to the commercial nuclear power business, the operating margin in the third quarter was (1%). For the first nine months of fiscal 2018 and 2017, excluding the third quarter charges previously noted, as well as a restructuring charge in each year, the operating margin was 2% and 6%, respectively. |
|
|
• |
Cash and short-term investments at December 31, 2017 were $74,182, compared with $72,102 on September 30, 2017 and $73,474 at March 31, 2017. |
17
Forward-Looking Statements
This report and other documents we file with the Securities and Exchange Commission include “forward-looking statements” within the meaning of Section 27A of the Securities Act of 1933, as amended, and Section 21E of the Securities Exchange Act of 1934, as amended.
These statements involve known and unknown risks, uncertainties and other factors that may cause actual results to be materially different from any future results implied by the forward-looking statements. Such factors include, but are not limited to, the risks and uncertainties identified by us under the heading "Risk Factors" in Item 1A of our Annual Report on Form 10-K for fiscal 2017.
Forward-looking statements may also include, but are not limited to, statements about:
|
|
• |
the current and future economic environments affecting us and the markets we serve; |
|
|
• |
expectations regarding investments in new projects by our customers; |
•sources of revenue and anticipated revenue, including the contribution from anticipated growth;
•expectations regarding achievement of revenue and profitability expectations;
•plans for future products and services and for enhancements to existing products and services;
|
|
• |
our operations in foreign countries; |
|
|
• |
political instability in regions in which our customers are located; |
|
|
• |
our ability to implement our growth and acquisition strategy; |
|
|
• |
our ability to maintain existing nuclear power work or expand nuclear power work into new markets; |
|
|
• |
our ability to maintain or expand nuclear power work for the U.S. Navy; |
|
|
• |
our ability to successfully execute our existing contracts; |
|
|
• |
estimates regarding our liquidity and capital requirements; |
|
|
• |
timing of conversion of backlog to sales; |
|
|
• |
our ability to attract or retain customers; |
|
|
• |
the outcome of any existing or future litigation; and |
|
|
• |
our ability to increase our productivity and capacity. |
Forward-looking statements are usually accompanied by words such as "anticipate," "believe," "estimate," "may," "might," "intend," "interest," "appear," "expect," "suggest," "plan," "encourage," "potential", "view" and similar expressions. Actual results could differ materially from historical results or those implied by the forward-looking statements contained in this report.
Undue reliance should not be placed on our forward-looking statements. Except as required by law, we undertake no obligation to update or announce any revisions to forward-looking statements contained in this report, whether as a result of new information, future events or otherwise.
Current Market Conditions
As a result of volatility in crude oil and natural gas prices, and near term price uncertainty, our global energy markets have been in a contracted state for the past three years. In response to the market conditions, our customers in the downstream energy sector have sharply reduced capital spending in each of the last three years. This impacted not only new capacity, but also revamping and turnaround for routine maintenance. Oil prices have risen over the past six months from $45 to over $60 per barrel. As a result, certain projects where our equipment is utilized have begun to proceed, however, it is not clear whether a sustained capital spending recovery in our markets has begun.
Capital spending in the nuclear market for both new capacity and to maintain existing facilities continues to trend downward. Capital spending in the nuclear market is down 25% to 35% compared with 3 to 4 years ago, according to a report from the Nuclear Energy Institute. Additionally, the March 2017 bankruptcy filing by Westinghouse Electric Company (“Westinghouse”) and the decision to cease building the two new reactors located in Summer, South Carolina has dramatically impacted the health of the
18
domestic nuclear market. The contracted capital spending within the commercial nuclear power market has had the effect of measurably reducing new orders and consequently reducing our sales.
Our long-term view for the refining and petrochemical markets is that fundamentals will drive increasing demand. These fundamentals include rising populations, strong emerging market economic growth, and overall global economic expansion, which we believe will result in capital investment necessary to satisfy increasing global energy demand.
Our naval nuclear propulsion market has demand tied to aircraft carrier and submarine vessel construction schedules of the primary shipyards who service the U.S. Navy. We expect growth in our naval nuclear propulsion business based on our strategic actions to increase our market share and expected demand. For more information, refer to the heading "Strategy and Outlook" within this Item 2 of this Quarterly Report on Form 10-Q.
In the near term, given the current market conditions, new order levels are expected to remain volatile from quarter to quarter.
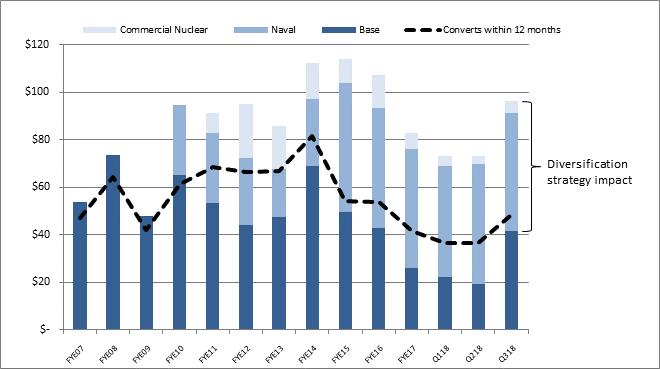
The chart below shows the impact of our diversification strategy. Nearly 60% of our backlog as of December 31, 2017 is from markets not served by us in the Fiscal 2007-2009 time frame.
Backlog Mix Illustrating Impact of Diversification Strategies
Backlog ($ million) at FYE*
*Fiscal year ended March 31
Results of Operations
To better understand the significant factors that influenced our performance during the periods presented, the following discussion should be read in conjunction with our Condensed Consolidated Financial Statements and the notes to our Condensed Consolidated Financial Statements included in Part I, Item 1, of this Quarterly Report on Form 10-Q.
The following table summarizes our results of operations for the periods indicated:
19
|
|
|
Three Months Ended |
|
|
Nine Months Ended |
|
||||||||||
|
|
|
December 31, |
|
|
December 31, |
|
||||||||||
|
|
|
2017 |
|
|
2016 |
|
|
2017 |
|
|
2016 |
|
||||
|
Net sales |
|
$ |
17,281 |
|
|
$ |
22,654 |
|
|
$ |
55,356 |
|
|
$ |
66,145 |
|
|
Gross profit |
|
$ |
3,585 |
|
|
$ |
6,301 |
|
|
$ |
12,281 |
|
|
$ |
15,422 |
|
|
Gross profit margin |
|
|
21 |
% |
|
|
28 |
% |
|
|
22 |
% |
|
|
23 |
% |
|
SG&A expense (1) |
|
$ |
4,066 |
|
|
$ |
3,804 |
|
|
$ |
11,447 |
|
|
$ |
10,637 |
|
|
SG&A as a percent of sales |
|
|
24 |
% |
|
|
17 |
% |
|
|
21 |
% |
|
|
16 |
% |
|
Net (loss) income |
|
$ |
(11,622 |
) |
|
$ |
1,840 |
|
|
$ |
(10,677 |
) |
|
$ |
3,222 |
|
|
Diluted (loss) income per share |
|
$ |
(1.19 |
) |
|
$ |
0.19 |
|
|
$ |
(1.09 |
) |
|
$ |
0.33 |
|
|
Total assets |
|
$ |
138,623 |
|
|
$ |
148,328 |
|
|
$ |
138,623 |
|
|
$ |
148,328 |
|
|
Total assets excluding cash, cash equivalents and investments |
|
$ |
64,441 |
|
|
$ |
75,651 |
|
|
$ |
64,441 |
|
|
$ |
75,651 |
|
|
|
(1) |
Selling, general and administrative expense is referred to as “SG&A”. |
The Third Quarter and First Nine Months of Fiscal 2018 Compared With the Third Quarter and First Nine Months
of Fiscal 2017
Sales for the third quarter of fiscal 2018 were $17,281, a 24% decrease as compared with sales of $22,654 for the third quarter of fiscal 2017. Our domestic sales, as a percentage of aggregate product sales, were 65% in the third quarter of fiscal 2018 compared with 77% in the third quarter of fiscal 2017. Domestic sales year-over-year decreased $6,160, or 35%. International sales increased $787, or 15%, in the third quarter of fiscal 2018 compared with the third quarter of fiscal 2017. Sales in the three months ended December 31, 2017 were 31% to the refining industry, 24% to the chemical and petrochemical industries, 10% to the power industry, including the nuclear market, and 35% to other commercial and industrial applications, including the U.S. Navy. Sales in the three months ended December 31, 2016 were 28% to the refining industry, 19% to the chemical and petrochemical industries, 19% to the power industry, including the nuclear market, and 34% to other commercial and industrial applications, including the U.S. Navy. Fluctuations in sales among markets, products and geographic locations can vary measurably from quarter-to-quarter based on timing and magnitude of projects. See also "Current Market Conditions," above. For additional information on anticipated future sales and our markets, see "Orders and Backlog" below.
Sales for the first nine months of fiscal 2018 were $55,356, a decrease of $10,789, or 16% compared with sales of $66,145 for the first nine months of fiscal 2017. The decrease in fiscal 2018 year-to-date sales was due to weaker domestic sales. Our domestic sales, as a percentage of aggregate product sales, were 67% in the first nine months of fiscal 2018 compared with 74% in the same period in fiscal 2017. Domestic sales decreased $11,900, or 24%, while international sales increased by $1,111, or 7%. International sales accounted for 33% and 26% of total sales for the first nine months of fiscal 2018 and fiscal 2017, respectively. Sales in the first nine months of fiscal 2018 were 25% to the refining industry, 30% to the chemical and petrochemical industries, 14% to the power industry, including the nuclear market, and 31% to other commercial and industrial applications, including the U.S. Navy. Sales in the first nine months of fiscal 2017 were 31% to the refining industry, 22% to the chemical and petrochemical industries, 23% to the power industry, including the nuclear market, and 24% to other commercial and industrial applications, including the U.S. Navy.
Our gross profit margin for the third quarter of fiscal 2018 was 21% compared with 28% for the third quarter of fiscal 2017. Gross profit for the third quarter of fiscal 2018 decreased 43% compared with fiscal 2017, to $3,585 from $6,301. Gross profit was impacted by lower sales and margins were impacted by a weaker mix of projects and less cost absorption.
Our gross profit margin for the first nine months of fiscal 2018 was 22% compared with 23% for the first nine months of fiscal 2017. Gross profit for the first nine months of fiscal 2018 decreased 20% compared with fiscal 2017, to $12,281 from $15,422. The decrease in gross profit was due to lower volume.
SG&A expenses as a percent of sales for the three and nine-month periods ended December 31, 2017 were 24% and 21%, respectively. SG&A expenses in the third quarter of fiscal 2018 were $4,066, an increase of $262, or 7%, compared with the third quarter of fiscal 2017 SG&A expenses of $3,804, due to bad debts in the commercial nuclear power market. Excluding the commercial nuclear power market bad debts, SG&A expenses were $3,832, or 22% of sales in the third quarter of fiscal 2018. SG&A expenses in the first nine months of fiscal 2018 were $11,447, an increase of $810, or 8%, compared with the first nine months of fiscal 2017 SG&A expenses of $10,637. This increase was principally related to the benefit of insurance proceeds of $759 received in the prior year and the $234 bad debt in the commercial nuclear power market in the current three-month period, as described below. Excluding these two items, SG&A expenses were $183, or 2%, lower.
20
During the third quarter of fiscal 2018, we performed our annual goodwill and intangible asset impairment review. We estimated the fair value of intangible assets and goodwill of our commercial nuclear power business related to the December 2010 acquisition of Energy Steel & Supply Co. (“Energy Steel”). The impairment review indicated that the fair value of the permits, tradename and goodwill of the business were substantially lower than the carrying value due to reduced investment from the U.S. nuclear power market, the strength of the Energy Steel brand relative to larger more vertically integrated suppliers, and the bankruptcy of Westinghouse which resulted in the stoppage of work at the Summer, SC nuclear facility. As a result, in the third quarter of fiscal 2018 we recorded impairment losses of $8,600, $500, and $5,716 for permits, tradename and goodwill, respectively. The total impairment charge was $14,816 before taxes and $12,852 after taxes. Additionally, we incurred a $46 revenue reversal, and a $234 bad debt charge, related to the bankruptcy of Westinghouse and the stoppage of work at the Summer, SC nuclear facility. The total before and after tax cost of these two charges was $280 and $208, respectively. Additionally, we recognized a gain of $1,416 related to the revaluation of deferred tax liabilities, which were impacted by the reduction in federal income tax rates from the Tax Act. The deferred tax gain of $1,438 included $2,034 for adjusting the rates on the deferred tax liability of the Energy Steel acquisition offset by a charge of $596 for other tax items.
Prior to the third quarter, in the first half of fiscal 2018, we incurred a pre-tax restructuring charge of $316 ($224 after tax) for severance costs related to certain headcount reductions. In the first half of fiscal 2017, we incurred a pre-tax restructuring charge of fiscal 2017 was $630 ($441 after tax) related to certain headcount reductions. The reduction in headcount in the first half of fiscal 2018 was approximately 6% of our global workforce. The annual savings from these reductions is expected to be $1,500. Approximately half of the savings should be realized in fiscal 2018.
Interest income for the three and nine-month periods ended December 31, 2017 was $142 and $455, respectively, compared with $100 and $272, respectively, for the same periods ended December 31, 2016. Interest expense for the three and nine-month periods ended December 31, 2017 was $3 and $8, respectively, compared with $3 and $7, respectively, for the same periods ended December 31, 2016.
The reduction in the year-to-date effective tax rate from 28% in the second quarter to 23% in the third quarter as well as in the first nine months of fiscal 2018 was due primarily to adjustments related to the Tax Act. The effective tax rates for the comparable three and nine month periods of fiscal 2017 were 29% and 27%, respectively.
Net (loss) income and (loss) income per diluted share for the third quarter of fiscal 2018 were ($11,622) and ($1.19), compared with $1,840 and $0.19, respectively, for the third quarter of fiscal 2017. Excluding impairment and other related charges for our commercial nuclear business as well as the gain from implementation of the Tax Act, net income and income per diluted share for the third quarter of fiscal 2018 were ($1) and $0.00, respectively, and were $1,840 and $0.19 in the third quarter of fiscal 2017. Net (loss) income and (loss) income per diluted share for the first nine months of fiscal 2018 were ($10,677) and ($1.09), respectively, compared with net income of $3,222 and income per diluted share of $0.33 for the first nine months of fiscal 2017. Excluding the items noted above as well as restructuring charges in each year, net income and income per diluted share for the first nine months of fiscal 2018 were $1,168 and $0.12, respectively, and were $3,663 and $0.38 in the first nine months of fiscal 2017.
Liquidity and Capital Resources
The following discussion should be read in conjunction with our Condensed Consolidated Balance Sheets and Condensed Consolidated Statements of Cash Flows:
|
|
|
December 31, |
|
|
March 31, |
|
||
|
|
|
2017 |
|
|
2017 |
|
||
|
Cash and investments |
|
$ |
74,182 |
|
|
$ |
73,474 |
|
|
Working capital |
|
|
78,369 |
|
|
|
78,688 |
|
|
Working capital ratio(1) |
|
|
3.3 |
|
|
|
3.5 |
|
|
Working capital excluding cash and investments |
|
|
4,187 |
|
|
|
5,214 |
|
|
|
(1) |
Working capital ratio equals current assets divided by current liabilities. |
Net cash generated by operating activities for the first nine months of fiscal 2018 was $3,874, compared with $10,707 for the first nine months of fiscal 2017. The decrease in cash generation year over year was attributable to lower earnings, an increase in accounts receivable, an increase in income taxes receivable and a smaller decrease in inventories, partly offset by higher unbilled revenue.
Dividend payments and capital expenditures in the first nine months of fiscal 2018 were $2,638 and $543, respectively, compared with $2,616 and $241, respectively, for the first nine months of fiscal 2017.
21
Capital expenditures for fiscal 2018 are expected to be between approximately $1,500 and $2,500. We have a capital project for approximately $1,500 which will be completed in the next few months, however, it is not clear whether the payments will occur in this fiscal year or early in next fiscal year. Approximately 80% of our fiscal 2018 capital expenditures are expected to be for productivity-enhancing machinery and equipment, with the remaining amounts expected to be used for information technology upgrades and other items.
Cash and investments were $74,182 on December 31, 2017 compared with $73,474 on March 31, 2017, up $708.
We invest net cash generated from operations in excess of cash held for near-term needs in short-term, less than 365 days, certificates of deposit, money market accounts or U.S. government instruments, generally with maturity periods of up to 180 days. Our money market account is used to securitize our outstanding letters of credit, which reduces our cost on those letters of credit. Approximately 95% of our cash and investments are held in the U.S. The remaining 5% is invested in our China operations.
Our revolving credit facility with JP Morgan Chase provides us with a line of credit of $25,000, including letters of credit and bank guarantees. In addition, our JP Morgan Chase agreement allows us to increase the line of credit, at our discretion, up to another $25,000, for total availability of $50,000. Borrowings under this credit facility are secured by all of our assets. We also have a $5,000 unsecured line of credit with HSBC, N.A. Letters of credit outstanding on December 31, 2017 and March 31, 2017 were $7,401 and $8,372, respectively. The outstanding letters of credit as of December 31, 2017 were issued by JP Morgan Chase, HSBC, as well as Bank of America (under our previous credit facility). There were no other amounts outstanding on our credit facilities at December 31, 2017 and March 31, 2017. The borrowing rate under our JP Morgan Chase facility as of December 31, 2017 was the bank’s prime rate, or 4.50%. Availability under the JP Morgan Chase and HSBC lines of credit was $25,168 and $25,761 at December 31, 2017 and March 31, 2017, respectively. We believe that cash generated from operations, combined with our investments and available financing capacity under our credit facility, will be adequate both to meet our cash needs for the immediate future and to support our growth strategies.
Orders and Backlog
Orders for the three-month period ended December 31, 2017 were $40,528 compared with $17,699 for the same period in the prior year, an increase of 129%. Orders represent written communications received from customers requesting us to supply products and/or services. Domestic orders were 47% of total orders, or $19,144, and international orders were 53% of total orders, or $21,384, in the current quarter compared with the third quarter of fiscal 2017, when domestic orders were 59%, or $10,396, of total orders, and international orders were 41%, or $7,303, of total orders. Over 80% of the international orders in the third quarter of fiscal 2018 were from Canada.
During the first nine months of fiscal 2018, orders were $68,679, compared with $57,123 for the same period of fiscal 2017, an increase of $11,556, or 20%. For the first nine months of fiscal 2018, refining orders increased by $19,121, power orders increased $812, chemical and petrochemical decreased by $6,167 and other commercial and industrial applications, including the U.S. Navy, decreased by $2,210. See “Current Market Conditions” above for additional information.
Backlog was $96,246 at December 31, 2017, compared with $72,981 at September 30, 2017, a 32% increase. Backlog is defined as the total dollar value of orders received for which revenue has not yet been recognized. Approximately 55% to 60% of orders currently in our backlog are expected to be converted to sales within one year, 5% to 10% are expected to ship between 12 and 24 months, and 25% to 35% beyond two years. The majority of the orders that are expected to convert beyond twelve months are for the U.S. Navy. At December 31, 2017, 35% of our backlog was attributable to equipment for refinery project work, 4% for chemical and petrochemical projects, 6% for power projects, including nuclear, 51% for U.S. Navy projects and 4% for other industrial applications. At December 31, 2016, 17% of our backlog was attributed to equipment for refinery project work, 14% for chemical and petrochemical projects, 9% for power projects, 57% for U.S. Navy projects and 3% for other industrial applications. At December 31, 2017, we had no projects on hold.
Strategy and Outlook
Prolonged weakness in the global energy markets has continued to negatively impact our business in fiscal 2018. Our oil refining and chemical market customer spending has started to improve compared with last year, but this will have no effect on our fiscal 2018 sales. We anticipate that the nuclear power market will continue to be weak and unpredictable during the next few years, and this determination led to the impairment of our goodwill and intangible assets which we recognized in the third quarter.
Despite the current downturn, we continue to believe in the long-term potential of the energy markets we serve. We intend to expand our participation and market share. We believe this anticipated long-term strength will support our strategy to significantly grow our business when the energy markets begin to recover. We have invested in capacity to serve our commercial, refining and chemical/petrochemical customers, as well as to expand the work we do for the U.S. Navy. In addition to these organic growth
22
opportunities, we continue to look for acquisitions or other business combinations that we believe will allow us to expand our presence in both our existing and ancillary markets. We are focused on growing our business, reducing earnings volatility, and further diversifying our business and product lines.
The prolonged contraction in the energy markets we serve continues to cause near-term uncertainty, affecting our outlook for fiscal 2018. We expect revenue in fiscal 2018 to be approximately $75,000.
We expect gross profit margin in fiscal 2018 to be in the 21% to 22% range. We are experiencing the impact of lower pricing from orders received over the past year and the under-utilization of our production facilities in fiscal 2018. We believe that production overhead absorption will be weak, which we expect in turn will put continued pressure on gross profit margins in our fourth quarter.
SG&A during fiscal 2018 is expected to be between $15,000 and $15,500. Our effective tax rate during fiscal 2018, excluding the tax effect of the impairment loss and the one-time impact of the new Tax Act recorded in the third quarter, is expected to be between 24% and 26%, which we have lowered due to the reduced federal corporate income tax rate. Fiscal 2018 will benefit from the fiscal fourth quarter being taxed at a lower rate.
We continue to expect operating cash flow in fiscal 2018 will be lower than fiscal 2017. Fiscal 2017 cash flow benefited from the build-up of customer deposits.
Contingencies and Commitments
We have been named as a defendant in lawsuits alleging personal injury from exposure to asbestos allegedly contained in or accompanying our products. We are a co-defendant with numerous other defendants in these lawsuits and intend to vigorously defend ourselves against these claims. The claims in our current lawsuits are similar to those made in previous asbestos lawsuits that named us as a defendant. Such previous lawsuits either were dismissed when it was shown that we had not supplied products to the plaintiffs’ places of work or were settled by us for immaterial amounts.
As of December 31, 2017, we are subject to the claims noted above, as well as other legal proceedings and potential claims that have arisen in the ordinary course of business. Although the outcome of the lawsuits, legal proceedings or potential claims to which we are or may become a party cannot be determined and an estimate of the reasonably possible loss or range of loss cannot be made, we do not believe that the outcomes, either individually or in the aggregate, will have a material effect on our results of operations, financial position or cash flows.
Critical Accounting Policies, Estimates, and Judgments
Our unaudited condensed consolidated financial statements are based on the selection of accounting policies and the application of significant accounting estimates, some of which require management to make significant assumptions. We believe that the most critical accounting estimates used in the preparation of our condensed consolidated financial statements relate to labor hour estimates and establishment of operational milestones which are used to recognize revenue under the percentage-of-completion method, fair value estimates of identifiable tangible and intangible assets acquired in business combinations, accounting for contingencies, under which we accrue a loss when it is probable that a liability has been incurred and the amount can be reasonably estimated, and accounting for pensions and other postretirement benefits. For further information, refer to Item 7 "Management's Discussion and Analysis of Financial Condition and Results of Operations" and Item 8 "Financial Statements and Supplementary Data" included in our Annual Report on Form 10-K for the year ended March 31, 2017.
Off Balance Sheet Arrangements
We did not have any off balance sheet arrangements as of December 31, 2017 or March 31, 2017, other than operating leases and letters of credit.
Item 3. Quantitative and Qualitative Disclosures About Market Risk
The principal market risks (i.e., the risk of loss arising from market changes) to which we are exposed are foreign currency exchange rates, price risk and project cancellation risk.
The assumptions applied in preparing the following qualitative and quantitative disclosures regarding foreign currency exchange rate, price risk and project cancellation risk are based upon volatility ranges experienced by us in relevant historical periods, our current knowledge of the marketplace, and our judgment of the probability of future volatility based upon the historical trends and economic conditions of the markets in which we operate.
23
Foreign Currency
International consolidated sales for the three months and nine months ended December 31, 2017 were 35% and 33%, respectively, of total sales compared with 23% and 26%, respectively, for the same periods of fiscal 2017. Operating in markets throughout the world exposes us to movements in currency exchange rates. Currency movements can affect sales in several ways, the foremost being our ability to compete for orders against foreign competitors that base their prices on relatively weaker currencies. Business lost due to competition for orders against competitors using a relatively weaker currency cannot be quantified. In addition, cash can be adversely impacted by the conversion of sales made by us in a foreign currency to U.S. dollars. In the first three and nine months of each of fiscal 2018 and fiscal 2017, all sales by us and our wholly-owned subsidiaries, for which we were paid, were denominated in the local currency of the respective subsidiary (U.S. dollars or Chinese RMB).
We have limited exposure to foreign currency purchases. In each of the first three and nine months of fiscal 2018, our purchases in foreign currencies represented 1% of cost of products sold. In the first three and nine months of 2017, our purchases in foreign currencies represented 2% and 3% of cost of products sold, respectively. At certain times, we may enter into forward foreign currency exchange agreements to hedge our exposure against potential unfavorable changes in foreign currency values on significant sales and purchase contracts negotiated in foreign currencies. Forward foreign currency exchange contracts were not used in the periods being reported on in this Quarterly Report on Form 10-Q and as of December 31, 2017 and March 31, 2017, we held no forward foreign currency contracts.
Price Risk
Operating in a global marketplace requires us to compete with other global manufacturers which, in some instances, benefit from lower production costs and more favorable economic conditions. Although we believe that our customers differentiate our products on the basis of our manufacturing quality and engineering experience and excellence, among other things, such lower production costs and more favorable economic conditions mean that certain of our competitors are able to offer products similar to ours at lower prices. In market downturns, we typically experience depressed price levels. Moreover, the cost of metals and other materials used in our products have experienced significant volatility. Such factors, in addition to the global effects of the ongoing volatility and disruption of the capital and credit markets, have resulted in downward demand and pricing pressure on our products.
Project Cancellation and Project Continuation Risk
Open orders are reviewed continuously through communications with customers. If it becomes evident to us that a project is delayed well beyond its original shipment date, management will move the project into "placed on hold" (i.e., suspended) category. Furthermore, if a project is cancelled by our customer, it is removed from our backlog. We attempt to mitigate the risk of cancellation by structuring contracts with our customers to maximize the likelihood that progress payments made to us for individual projects cover the costs we have incurred. As a result, we do not believe we have a significant cash exposure to projects which may be cancelled. At December 31, 2017, we had no projects on hold.
Item 4.Controls and Procedures
Conclusion regarding the effectiveness of disclosure controls and procedures
Our President and Chief Executive Officer (principal executive officer) and Vice President-Finance & Administration and Chief Financial Officer (principal financial officer) each have evaluated the effectiveness of our disclosure controls and procedures (as defined in Exchange Act Rules 13a-15(e) and 15d-15(e)) as of the end of the period covered by this Quarterly Report on Form 10-Q. Based on such evaluation, and as of such date, our President and Chief Executive Officer and Vice President-Finance & Administration and Chief Financial Officer concluded that our disclosure controls and procedures were effective in all material respects.
Changes in internal control over financial reporting
There has been no change to our internal control over financial reporting during the quarter covered by this Quarterly Report on Form 10-Q that has materially affected, or that is reasonably likely to materially affect, our internal control over financial reporting.
24
GRAHAM CORPORATION AND SUBSIDIARIES
FORM 10-Q
DECEMBER 31, 2017
PART II - OTHER INFORMATION
|
|
|
|
||
|
(31) |
|
Rule 13a-14(a)/15d-14(a) Certifications |
||
|
|
|
|
|
|
|
+ |
|
31.1 |
||
|
|
|
|
|
|
|
+ |
|
31.2 |
||
|
|
|
|
|
|
|
(32) |
|
Section 1350 Certification |
||
|
|
|
|
|
|
|
+ |
|
32.1 |
||
|
|
|
|
|
|
|
(101) |
|
Interactive Data File |
||
|
|
|
|
|
|
|
+ |
|
101.INS |
XBRL Instance Document |
|
|
|
|
|
|
|
|
+ |
|
101.SCH |
XBRL Taxonomy Extension Schema Document |
|
|
|
|
|
|
|
|
+ |
|
101.CAL |
XBRL Taxonomy Extension Calculation Linkbase Document |
|
|
|
|
|
|
|
|
+ |
|
101.DEF |
XBRL Taxonomy Extension Definition Linkbase Document |
|
|
|
|
|
|
|
|
+ |
|
101.LAB |
XBRL Taxonomy Extension Label Linkbase Document |
|
|
|
|
|
|
|
|
+ |
|
101.PRE |
XBRL Taxonomy Extension Presentation Linkbase Document |
|
|
|
|
|
|
|
|
|
|
|
|
|
|
|
|
+ |
Exhibit filed with this report |
|
|
|
|
|
|
|
|
|
|
|
|
|
25
Pursuant to the requirements of the Securities Exchange Act of 1934, the registrant has duly caused this report to be signed on its behalf by the undersigned thereunto duly authorized.
|
|
GRAHAM CORPORATION
|
||
|
By: |
|
|
/s/ Jeffrey Glajch |
|
|
|
|
Jeffrey Glajch |
|
|
|
|
Vice President-Finance & Administration and |
|
|
|
|
Chief Financial Officer |
Date: February 2, 2018
26