UNITED STATES
SECURITIES AND EXCHANGE COMMISSION
WASHINGTON, D.C. 20549
FORM 10-Q
(Mark One)
|
☒ |
QUARTERLY REPORT PURSUANT TO SECTION 13 OR 15(d) OF THE SECURITIES EXCHANGE ACT OF 1934 |
For the quarterly period ended June 30, 2019
or
|
☐ |
TRANSITION REPORT PURSUANT TO SECTION 13 OR 15(d) OF THE SECURITIES EXCHANGE ACT OF 1934 |
For the transition period from _____________ to ___________
Commission File Number 1-8462
GRAHAM CORPORATION
(Exact name of registrant as specified in its charter)
|
Delaware |
16-1194720 |
|
(State or other jurisdiction of incorporation or organization) |
(I.R.S. Employer Identification No.) |
|
20 Florence Avenue, Batavia, New York |
14020 |
|
(Address of principal executive offices) |
(Zip Code) |
585-343-2216
(Registrant's telephone number, including area code)
Securities registered pursuant to Section 12(b) of the Act:
|
Title of each class |
|
Trading Symbol(s) |
|
Name of each exchange on which registered |
|
Common Stock, Par Value $0.10 Per Share |
|
GHM |
|
NYSE |
Indicate by check mark whether the registrant (1) has filed all reports required to be filed by Section 13 or 15(d) of the Securities Exchange Act of 1934 during the preceding 12 months (or for such shorter period that the registrant was required to file such reports), and (2) has been subject to such filing requirements for the past 90 days. Yes ☒ No ☐
Indicate by check mark whether the registrant has submitted electronically every Interactive Data File required to be submitted pursuant to Rule 405 of Regulation S-T (§232.405 of this chapter) during the preceding 12 months (or for such shorter period that the registrant was required to submit such files). Yes ☒ No ☐
Indicate by check mark whether the registrant is a large accelerated filer, an accelerated filer, a non-accelerated filer, a smaller reporting company, or an emerging growth company. See definition of "large accelerated filer," "accelerated filer," "smaller reporting company," and "emerging growth company" in Rule 12b-2 of the Exchange Act.
|
Large accelerated filer |
☐ |
|
Accelerated filer |
☒ |
|
Non-accelerated filer |
☐ |
|
Smaller reporting company |
☐ |
|
Emerging growth company |
☐ |
|
|
|
If an emerging growth company, indicate by check mark if the registrant has elected not to use the extended transition period for complying with any new or revised financial accounting standards provided pursuant to Section 13(a) of the Exchange Act. ☐
Indicate by check mark whether the registrant is a shell company (as defined in Rule 12b-2 of the Exchange Act).
Yes ☐ No ☒
As of July 25, 2019, there were outstanding 9,880,798 shares of the registrant’s common stock, par value $.10 per share.
Graham Corporation and Subsidiaries
Index to Form 10-Q
As of June 30, 2019 and March 31, 2019 and for the three months ended June 30, 2019 and 2018
|
|
|
Page |
|
Part I. |
|
|
|
|
|
|
|
Item 1. |
4 |
|
|
|
|
|
|
Item 2. |
Management’s Discussion and Analysis of Financial Condition and Results of Operations |
19 |
|
|
|
|
|
Item 3. |
25 |
|
|
|
|
|
|
Item 4. |
26 |
|
|
|
|
|
|
Part II. |
|
|
|
|
|
|
|
Item 2. |
27 |
|
|
|
|
|
|
Item 6. |
27 |
|
|
|
|
|
|
29 |
||
|
|
|
|
2
GRAHAM CORPORATION AND SUBSIDIARIES
FORM 10-Q
JUNE 30, 2019
PART I – FINANCIAL INFORMATION
3
GRAHAM CORPORATION AND SUBSIDIARIES
CONDENSED CONSOLIDATED STATEMENTS OF INCOME AND RETAINED EARNINGS
(Unaudited)
|
|
|
Three Months Ended |
|
|||||
|
|
|
June 30, |
|
|||||
|
|
|
2019 |
|
|
2018 |
|
||
|
|
|
(Amounts in thousands, except per share data) |
|
|||||
|
Net sales |
|
$ |
20,593 |
|
|
$ |
29,551 |
|
|
Cost of products sold |
|
|
15,879 |
|
|
|
22,409 |
|
|
Gross profit |
|
|
4,714 |
|
|
|
7,142 |
|
|
Other expenses and income: |
|
|
|
|
|
|
|
|
|
Selling, general and administrative |
|
|
4,556 |
|
|
|
4,551 |
|
|
Selling, general and administrative – amortization |
|
|
11 |
|
|
|
59 |
|
|
Other expense |
|
|
523 |
|
|
|
— |
|
|
Other income |
|
|
(87 |
) |
|
|
(206 |
) |
|
Interest income |
|
|
(399 |
) |
|
|
(289 |
) |
|
Interest expense |
|
|
3 |
|
|
|
2 |
|
|
Total other expenses and income |
|
|
4,607 |
|
|
|
4,117 |
|
|
Income before provision for income taxes |
|
|
107 |
|
|
|
3,025 |
|
|
Provision for income taxes |
|
|
25 |
|
|
|
702 |
|
|
Net income |
|
|
82 |
|
|
|
2,323 |
|
|
Retained earnings at beginning of period |
|
|
93,847 |
|
|
|
99,011 |
|
|
Cumulative effect of change in accounting principle, net of income tax benefit of $22 and $301 for the three months ended June 30, 2019 and 2018, respectively |
|
|
(80 |
) |
|
|
(1,022 |
) |
|
Dividends |
|
|
(988 |
) |
|
|
(885 |
) |
|
Retained earnings at end of period |
|
$ |
92,861 |
|
|
$ |
99,427 |
|
|
Per share data |
|
|
|
|
|
|
|
|
|
Basic: |
|
|
|
|
|
|
|
|
|
Net income |
|
$ |
0.01 |
|
|
$ |
0.24 |
|
|
Diluted: |
|
|
|
|
|
|
|
|
|
Net income |
|
$ |
0.01 |
|
|
$ |
0.24 |
|
|
Weighted average common shares outstanding: |
|
|
|
|
|
|
|
|
|
Basic |
|
|
9,855 |
|
|
|
9,790 |
|
|
Diluted |
|
|
9,858 |
|
|
|
9,804 |
|
|
Dividends declared per share |
|
$ |
0.10 |
|
|
$ |
0.09 |
|
See Notes to Condensed Consolidated Financial Statements.
4
GRAHAM CORPORATION AND SUBSIDIARIES
CONDENSED CONSOLIDATED STATEMENTS OF COMPREHENSIVE INCOME
(Unaudited)
|
|
|
Three Months Ended |
|
|||||
|
|
|
June 30, |
|
|||||
|
|
|
2019 |
|
|
2018 |
|
||
|
|
|
(Amounts in thousands) |
|
|||||
|
Net income |
|
$ |
82 |
|
|
$ |
2,323 |
|
|
Other comprehensive income (loss): |
|
|
|
|
|
|
|
|
|
Foreign currency translation adjustment |
|
|
(87 |
) |
|
|
(199 |
) |
|
Defined benefit pension and other postretirement plans net of income tax expense of $55 and $49, for the three months ended June 30, 2019 and 2018, respectively |
|
|
194 |
|
|
|
170 |
|
|
Total other comprehensive income (loss) |
|
|
107 |
|
|
|
(29 |
) |
|
Total comprehensive income |
|
$ |
189 |
|
|
$ |
2,294 |
|
See Notes to Condensed Consolidated Financial Statements.
5
GRAHAM CORPORATION AND SUBSIDIARIES
CONDENSED CONSOLIDATED BALANCE SHEETS
(Unaudited)
|
|
|
June 30, |
|
|
March 31, |
|
||
|
|
|
2019 |
|
|
2019 |
|
||
|
|
|
(Amounts in thousands, except per share data) |
|
|||||
|
Assets |
|
|
|
|
|
|
|
|
|
Current assets: |
|
|
|
|
|
|
|
|
|
Cash and cash equivalents |
|
$ |
13,768 |
|
|
$ |
15,021 |
|
|
Investments |
|
|
58,789 |
|
|
|
62,732 |
|
|
Trade accounts receivable, net of allowances ($41 and $33 at June 30 and March 31, 2019, respectively) |
|
|
14,417 |
|
|
|
17,582 |
|
|
Unbilled revenue |
|
|
9,845 |
|
|
|
7,522 |
|
|
Inventories |
|
|
24,092 |
|
|
|
24,670 |
|
|
Prepaid expenses and other current assets |
|
|
1,456 |
|
|
|
1,333 |
|
|
Income taxes receivable |
|
|
1,260 |
|
|
|
1,073 |
|
|
Assets held for sale |
|
|
— |
|
|
|
4,850 |
|
|
Total current assets |
|
|
123,627 |
|
|
|
134,783 |
|
|
Property, plant and equipment, net |
|
|
16,836 |
|
|
|
17,071 |
|
|
Prepaid pension asset |
|
|
4,485 |
|
|
|
4,267 |
|
|
Operating lease assets |
|
|
271 |
|
|
|
— |
|
|
Other assets |
|
|
112 |
|
|
|
149 |
|
|
Total assets |
|
$ |
145,331 |
|
|
$ |
156,270 |
|
|
Liabilities and stockholders’ equity |
|
|
|
|
|
|
|
|
|
Current liabilities: |
|
|
|
|
|
|
|
|
|
Current portion of capital lease obligations |
|
$ |
51 |
|
|
$ |
51 |
|
|
Accounts payable |
|
|
6,797 |
|
|
|
12,405 |
|
|
Accrued compensation |
|
|
4,660 |
|
|
|
5,126 |
|
|
Accrued expenses and other current liabilities |
|
|
2,382 |
|
|
|
2,933 |
|
|
Customer deposits |
|
|
30,556 |
|
|
|
30,847 |
|
|
Operating lease liabilities |
|
|
99 |
|
|
|
— |
|
|
Liabilities held for sale |
|
|
— |
|
|
|
3,525 |
|
|
Total current liabilities |
|
|
44,545 |
|
|
|
54,887 |
|
|
Capital lease obligations |
|
|
85 |
|
|
|
95 |
|
|
Operating lease liabilities |
|
|
167 |
|
|
|
— |
|
|
Deferred income tax liability |
|
|
1,297 |
|
|
|
1,056 |
|
|
Accrued pension liability |
|
|
684 |
|
|
|
662 |
|
|
Accrued postretirement benefits |
|
|
608 |
|
|
|
604 |
|
|
Total liabilities |
|
|
47,386 |
|
|
|
57,304 |
|
|
Commitments and contingencies (Note 12) |
|
|
|
|
|
|
|
|
|
Stockholders’ equity: |
|
|
|
|
|
|
|
|
|
Preferred stock, $1.00 par value, 500 shares authorized |
|
|
— |
|
|
|
— |
|
|
Common stock, $.10 par value, 25,500 shares authorized, 10,699 and 10,650 shares issued and 9,881 and 9,843 shares outstanding at June 30 and March 31, 2019, respectively |
|
|
1,070 |
|
|
|
1,065 |
|
|
Capital in excess of par value |
|
|
25,360 |
|
|
|
25,277 |
|
|
Retained earnings |
|
|
92,861 |
|
|
|
93,847 |
|
|
Accumulated other comprehensive loss |
|
|
(8,726 |
) |
|
|
(8,833 |
) |
|
Treasury stock (818 and 807 shares at June 30 and March 31, 2019, respectively) |
|
|
(12,620 |
) |
|
|
(12,390 |
) |
|
Total stockholders’ equity |
|
|
97,945 |
|
|
|
98,966 |
|
|
Total liabilities and stockholders’ equity |
|
$ |
145,331 |
|
|
$ |
156,270 |
|
See Notes to Condensed Consolidated Financial Statements.
6
GRAHAM CORPORATION AND SUBSIDIARIES
CONDENSED CONSOLIDATED STATEMENTS OF CASH FLOWS
(Unaudited)
|
|
|
|
|
|||||
|
|
|
June 30, |
|
|||||
|
|
|
2019 |
|
|
2018 |
|
||
|
Operating activities: |
|
(Dollar amounts in thousands) |
|
|||||
|
Net income |
|
$ |
82 |
|
|
$ |
2,323 |
|
|
Adjustments to reconcile net income to net cash (used) provided by operating activities: |
|
|
|
|
|
|
|
|
|
Depreciation |
|
|
490 |
|
|
|
490 |
|
|
Amortization |
|
|
11 |
|
|
|
59 |
|
|
Amortization of unrecognized prior service cost and actuarial losses |
|
|
249 |
|
|
|
219 |
|
|
Equity-based compensation expense |
|
|
88 |
|
|
|
260 |
|
|
Loss on disposal or sale of property, plant and equipment |
|
|
— |
|
|
|
31 |
|
|
Loss on sale of Energy Steel & Supply Co. |
|
|
87 |
|
|
|
— |
|
|
Deferred income taxes |
|
|
202 |
|
|
|
201 |
|
|
(Increase) decrease in operating assets: |
|
|
|
|
|
|
|
|
|
Accounts receivable |
|
|
3,088 |
|
|
|
5,543 |
|
|
Unbilled revenue |
|
|
(2,323 |
) |
|
|
(6,539 |
) |
|
Inventories |
|
|
552 |
|
|
|
5,150 |
|
|
Prepaid expenses and other current and non-current assets |
|
|
(166 |
) |
|
|
(451 |
) |
|
Income taxes receivable |
|
|
(187 |
) |
|
|
485 |
|
|
Operating lease assets |
|
|
105 |
|
|
|
— |
|
|
Prepaid pension asset |
|
|
(218 |
) |
|
|
(288 |
) |
|
Increase (decrease) in operating liabilities: |
|
|
|
|
|
|
|
|
|
Accounts payable |
|
|
(5,565 |
) |
|
|
(7,122 |
) |
|
Accrued compensation, accrued expenses and other current and non-current liabilities |
|
|
(1,005 |
) |
|
|
322 |
|
|
Customer deposits |
|
|
(242 |
) |
|
|
(643 |
) |
|
Operating lease liabilities |
|
|
(27 |
) |
|
|
— |
|
|
Long-term portion of accrued compensation, accrued pension liability and accrued postretirement benefits |
|
|
26 |
|
|
|
28 |
|
|
Net cash (used) provided by operating activities |
|
|
(4,753 |
) |
|
|
68 |
|
|
Investing activities: |
|
|
|
|
|
|
|
|
|
Purchase of property, plant and equipment |
|
|
(294 |
) |
|
|
(163 |
) |
|
Proceeds from the sale of Energy Steel & Supply Co. |
|
|
602 |
|
|
|
— |
|
|
Purchase of investments |
|
|
(28,651 |
) |
|
|
(55,611 |
) |
|
Redemption of investments at maturity |
|
|
32,595 |
|
|
|
33,023 |
|
|
Net cash provided (used) by investing activities |
|
|
4,252 |
|
|
|
(22,751 |
) |
|
Financing activities: |
|
|
|
|
|
|
|
|
|
Principal repayments on capital lease obligations |
|
|
(10 |
) |
|
|
(26 |
) |
|
Issuance of common stock |
|
|
— |
|
|
|
102 |
|
|
Dividends paid |
|
|
(988 |
) |
|
|
(885 |
) |
|
Purchase of treasury stock |
|
|
(230 |
) |
|
|
(146 |
) |
|
Net cash used by financing activities |
|
|
(1,228 |
) |
|
|
(955 |
) |
|
Effect of exchange rate changes on cash |
|
|
(76 |
) |
|
|
(141 |
) |
|
Net decrease in cash and cash equivalents, including cash classified within current assets held for sale |
|
|
(1,805 |
) |
|
|
(23,779 |
) |
|
Plus: Net decrease in cash classified within current assets held for sale |
|
|
552 |
|
|
|
— |
|
|
Net decrease in cash and cash equivalents |
|
|
(1,253 |
) |
|
|
(23,779 |
) |
|
Cash and cash equivalents at beginning of period |
|
|
15,021 |
|
|
|
40,456 |
|
|
Cash and cash equivalents at end of period |
|
$ |
13,768 |
|
|
$ |
16,677 |
|
See Notes to Condensed Consolidated Financial Statements.
7
GRAHAM CORPORATION AND SUBSIDIARIES
CONDENSED CONSOLIDATED STATEMENTS OF CHANGES IN STOCKHOLDERS’ EQUITY
(Unaudited)
|
|
|
Common Stock |
|
|
Capital in |
|
|
|
|
|
|
Accumulated Other |
|
|
|
|
|
|
Total |
|
||||||||
|
|
|
|
|
|
|
Par |
|
|
Excess of |
|
|
Retained |
|
|
Comprehensive |
|
|
Treasury |
|
|
Stockholders' |
|
||||||
|
|
|
Shares |
|
|
Value |
|
|
Par Value |
|
|
Earnings |
|
|
Loss |
|
|
Stock |
|
|
Equity |
|
|||||||
|
Balance at April 1, 2019 |
|
|
10,650 |
|
|
$ |
1,065 |
|
|
$ |
25,277 |
|
|
$ |
93,847 |
|
|
$ |
(8,833 |
) |
|
$ |
(12,390 |
) |
|
$ |
98,966 |
|
|
Cumulative effect of change in accounting principle |
|
|
|
|
|
|
|
|
|
|
|
|
|
|
(80 |
) |
|
|
|
|
|
|
|
|
|
|
(80 |
) |
|
Comprehensive income |
|
|
|
|
|
|
|
|
|
|
|
|
|
|
82 |
|
|
|
107 |
|
|
|
|
|
|
|
189 |
|
|
Issuance of shares |
|
|
83 |
|
|
|
8 |
|
|
|
(8 |
) |
|
|
|
|
|
|
|
|
|
|
|
|
|
|
— |
|
|
Forfeiture of shares |
|
|
(34 |
) |
|
|
(3 |
) |
|
|
3 |
|
|
|
|
|
|
|
|
|
|
|
|
|
|
|
— |
|
|
Dividends |
|
|
|
|
|
|
|
|
|
|
|
|
|
|
(988 |
) |
|
|
|
|
|
|
|
|
|
|
(988 |
) |
|
Recognition of equity-based compensation expense |
|
|
|
|
|
|
|
|
|
|
88 |
|
|
|
|
|
|
|
|
|
|
|
|
|
|
|
88 |
|
|
Purchase of treasury stock |
|
|
|
|
|
|
|
|
|
|
|
|
|
|
|
|
|
|
|
|
|
|
(230 |
) |
|
|
(230 |
) |
|
Balance at June 30, 2019 |
|
|
10,699 |
|
|
$ |
1,070 |
|
|
$ |
25,360 |
|
|
$ |
92,861 |
|
|
$ |
(8,726 |
) |
|
$ |
(12,620 |
) |
|
$ |
97,945 |
|
|
|
|
Common Stock |
|
|
Capital in |
|
|
|
|
|
|
Accumulated Other |
|
|
|
|
|
|
Total |
|
||||||||
|
|
|
|
|
|
|
Par |
|
|
Excess of |
|
|
Retained |
|
|
Comprehensive |
|
|
Treasury |
|
|
Stockholders' |
|
||||||
|
|
|
Shares |
|
|
Value |
|
|
Par Value |
|
|
Earnings |
|
|
Loss |
|
|
Stock |
|
|
Equity |
|
|||||||
|
Balance at April 1, 2018 |
|
|
10,579 |
|
|
$ |
1,058 |
|
|
$ |
23,826 |
|
|
$ |
99,011 |
|
|
$ |
(8,250 |
) |
|
$ |
(12,296 |
) |
|
$ |
103,349 |
|
|
Cumulative effect of change in accounting principle |
|
|
|
|
|
|
|
|
|
|
|
|
|
|
(1,022 |
) |
|
|
|
|
|
|
|
|
|
|
(1,022 |
) |
|
Comprehensive income |
|
|
|
|
|
|
|
|
|
|
|
|
|
|
2,323 |
|
|
|
(29 |
) |
|
|
|
|
|
|
2,294 |
|
|
Issuance of shares |
|
|
59 |
|
|
|
6 |
|
|
|
96 |
|
|
|
|
|
|
|
|
|
|
|
|
|
|
|
102 |
|
|
Dividends |
|
|
|
|
|
|
|
|
|
|
|
|
|
|
(885 |
) |
|
|
|
|
|
|
|
|
|
|
(885 |
) |
|
Recognition of equity-based compensation expense |
|
|
|
|
|
|
|
|
|
|
260 |
|
|
|
|
|
|
|
|
|
|
|
|
|
|
|
260 |
|
|
Purchase of treasury stock |
|
|
|
|
|
|
|
|
|
|
|
|
|
|
|
|
|
|
|
|
|
|
(146 |
) |
|
|
(146 |
) |
|
Balance at June 30, 2018 |
|
|
10,638 |
|
|
$ |
1,064 |
|
|
$ |
24,182 |
|
|
$ |
99,427 |
|
|
$ |
(8,279 |
) |
|
$ |
(12,442 |
) |
|
$ |
103,952 |
|
See Notes to Condensed Consolidated Financial Statements.
8
GRAHAM CORPORATION AND SUBSIDIARIES
NOTES TO CONDENSED CONSOLIDATED FINANCIAL STATEMENTS
(Unaudited)
(Amounts in thousands, except per share data)
NOTE 1 – BASIS OF PRESENTATION:
Graham Corporation's (the "Company's") Condensed Consolidated Financial Statements include its wholly-owned foreign subsidiaries located in Suzhou, China and Ahmedabad, India. During the fiscal year ended March 31, 2019 ("fiscal 2019") the Company decided to divest of its wholly-owned domestic subsidiary, Energy Steel & Supply Co. ("Energy Steel"), located in Lapeer, Michigan. The sale of Energy Steel was completed in June 2019 and the accompanying Condensed Consolidated Financial Statements include the results of operations of Energy Steel for the period April 1, 2019 through June 23, 2019. The Condensed Consolidated Financial Statements have been prepared in accordance with accounting principles generally accepted in the U.S. ("GAAP") for interim financial information and the instructions to Form 10-Q and Rule 10-01 of Regulation S-X, each as promulgated by the U.S. Securities and Exchange Commission. The Company's Condensed Consolidated Financial Statements do not include all information and notes required by GAAP for complete financial statements. The unaudited Condensed Consolidated Balance Sheet as of March 31, 2019 presented herein was derived from the Company’s audited Consolidated Balance Sheet as of March 31, 2019. For additional information, please refer to the consolidated financial statements and notes included in the Company's Annual Report on Form 10-K for fiscal 2019. In the opinion of management, all adjustments, including normal recurring accruals considered necessary for a fair presentation, have been included in the Company's Condensed Consolidated Financial Statements.
The Company's results of operations and cash flows for the three months ended June 30, 2019 are not necessarily indicative of the results that may be expected for the current fiscal year, which ends March 31, 2020 ("fiscal 2020").
NOTE 2 – REVENUE RECOGNITION:
The Company accounts for revenue in accordance with Accounting Standard Codification 606, “Revenue from Contracts with Customers” (“ASC 606”), which it adopted on April 1, 2018 using the modified retrospective approach.
The Company recognizes revenue on contracts when or as it satisfies a performance obligation by transferring control of the product to the customer. For contracts in which revenue is recognized upon shipment, control is generally transferred when products are shipped, title is transferred, significant risks of ownership have transferred, the Company has rights to payment, and rewards of ownership pass to the customer. For contracts in which revenue is recognized over time, control is generally transferred as the Company creates an asset that does not have an alternative use to the Company and the Company has an enforceable right to payment for the performance completed to date.
The following table presents the Company’s revenue disaggregated by product line and geographic area:
|
|
|
Three Months Ended |
|
|||||
|
|
|
June 30, |
|
|||||
|
Product Line |
|
2019 |
|
|
2018 |
|
||
|
Heat transfer equipment |
|
$ |
7,852 |
|
|
$ |
4,158 |
|
|
Vacuum equipment |
|
|
5,530 |
|
|
|
17,216 |
|
|
All other |
|
|
7,211 |
|
|
|
8,177 |
|
|
Net sales |
|
$ |
20,593 |
|
|
$ |
29,551 |
|
|
|
|
|
|
|
|
|
|
|
|
|
|
|
|
|
|
|
|
|
|
Geographic Region |
|
|
|
|
|
|
|
|
|
Asia |
|
$ |
3,219 |
|
|
$ |
2,749 |
|
|
Canada |
|
|
1,348 |
|
|
|
11,650 |
|
|
Middle East |
|
|
773 |
|
|
|
435 |
|
|
South America |
|
|
359 |
|
|
|
124 |
|
|
U.S. |
|
|
14,448 |
|
|
|
13,453 |
|
|
All other |
|
|
446 |
|
|
|
1,140 |
|
|
Net sales |
|
$ |
20,593 |
|
|
$ |
29,551 |
|
9
A performance obligation represents a promise in a contract to provide a distinct good or service to a customer and is the unit of accounting pursuant to ASC 606. The Company accounts for a contract when it has approval and commitment from both parties, the rights of the parties are identified, payment terms are identified, the contract has commercial substance and collectability of consideration is probable. Transaction price reflects the amount of consideration to which the Company expects to be entitled in exchange for transferred products. A contract’s transaction price is allocated to each distinct performance obligation and revenue is recognized as the performance obligation is satisfied. In certain cases, the Company may separate a contract into more than one performance obligation, while in other cases, several products may be part of a fully integrated solution and are bundled into a single performance obligation. If a contract is separated into more than one performance obligation, the Company allocates the total transaction price to each performance obligation in an amount based on the estimated relative standalone selling prices of the promised goods underlying each performance obligation. The Company has made an accounting policy election to exclude from the measurement of the contract price all taxes assessed by government authorities that are collected by the Company from its customers. The Company does not adjust the contract price for the effects of a financing component if the Company expects, at contract inception, that the period between when a product is transferred to a customer and when the customer pays for the product will be one year or less. Shipping and handling fees billed to the customer are recorded in revenue and the related costs incurred for shipping and handling are included in cost of products sold.
Revenue on the majority of the Company’s contracts, as measured by number of contracts, is recognized upon shipment to the customer, however, revenue on larger contracts, which are fewer in number but represent the majority of revenue, is recognized over time as these contracts meet specific criteria established in ASC 606. Revenue from contracts that is recognized upon shipment accounted for approximately 45% and 30% of revenue for the three-month periods ended June 30, 2019 and 2018, respectively, and revenue from contracts that is recognized over time accounted for approximately 55% and 70% of revenue for the three-month periods ended June 30, 2019 and 2018, respectively. The Company recognizes revenue over time when contract performance results in the creation of a product for which the Company does not have an alternative use and the contract includes an enforceable right to payment in an amount that corresponds directly with the value of the performance completed. To measure progress towards completion on performance obligations for which revenue is recognized over time the Company utilizes an input method based upon a ratio of direct labor hours incurred to date to management’s estimate of the total labor hours to be incurred on each contract or an output method based upon completion of operational milestones, depending upon the nature of the contract. The Company has established the systems and procedures essential to developing the estimates required to account for performance obligations over time. These procedures include monthly review by management of costs incurred, progress towards completion, identified risks and opportunities, sourcing determinations, changes in estimates of costs yet to be incurred, availability of materials, and execution by subcontractors. Sales and earnings are adjusted in current accounting periods based on revisions in the contract value due to pricing changes and estimated costs at completion. Losses on contracts are recognized immediately when evident to management.
The timing of revenue recognition, invoicing and cash collections affect trade accounts receivable, unbilled revenue (contract assets) and customer deposits (contract liabilities) on the Condensed Consolidated Balance Sheets. Unbilled revenue represents revenue on contracts that is recognized over time and exceeds the amount that has been billed to the customer. Unbilled revenue is separately presented in the Condensed Consolidated Balance Sheets. The Company may have an unconditional right to payment upon billing and prior to satisfying the performance obligations. The Company will then record a contract liability and an offsetting asset of equal amount until the deposit is collected and the performance obligations are satisfied. Customer deposits are separately presented in the Condensed Consolidated Balance Sheets. Customer deposits are not considered a significant financing component as they are generally received less than one year before the product is completed or used to procure specific material on a contract, as well as related overhead costs incurred during design and construction.
Net contract assets (liabilities) consisted of the following:
|
|
|
June 30, 2019 |
|
|
March 31, 2019 |
|
|
Change |
|
|||
|
|
|
|
|
|
|
|
|
|||||
|
Unbilled revenue (contract assets) |
|
$ |
9,845 |
|
|
$ |
7,522 |
|
|
$ |
2,323 |
|
|
Customer deposits (contract liabilities) |
|
|
(30,556 |
) |
|
|
(30,847 |
) |
|
|
291 |
|
|
Net contract liabilities |
|
$ |
(20,711 |
) |
|
$ |
(23,325 |
) |
|
$ |
2,614 |
|
Contract liabilities at June 30, 2019 and March 31, 2019 include $5,134 and $6,382, respectively, of customer deposits for which the Company has an unconditional right to collect payment. Trade accounts receivable, as presented on the Condensed Consolidated Balance Sheets, includes corresponding balances at June 30, 2019 and March 31, 2019, respectively. Revenue recognized in the three months ended June 30, 2019 that was included in the contract liability balance at March 31, 2019 was $5,422. Changes in the net contract liability balance during the three-month period ended June 30, 2019 were impacted by a $2,323 increase in contract assets, of which $2,935 was due to contract progress offset by invoicing to customers of $612. In addition, contract liabilities decreased $291 driven by revenue recognized in the current period that was included in the contract liability balance at March 31, 2019 offset by new customer deposits of $5,131.
10
Receivables billed but not paid under retainage provisions in the Company’s customer contracts were $2,102 and $2,214 at June 30, 2019 and March 31, 2019, respectively.
Incremental costs to obtain a contract consist of sales employee and agent commissions. Commissions paid to employees and sales agents are capitalized when paid and amortized to selling, general and administrative expense when the related revenue is recognized. Capitalized costs, net of amortization, to obtain a contract were $128 and $133 at June 30, 2019 and March 31, 2019, respectively, and are included in the line item "Prepaid expenses and other current assets" in the Condensed Consolidated Balance Sheets. The related amortization expense was $46 and $40 in the three months ended June 30, 2019 and 2018, respectively.
The Company’s remaining unsatisfied performance obligations represent a measure of the total dollar value of work to be performed on contracts awarded and in progress. The Company also refers to this measure as backlog. As of June 30, 2019, the Company had remaining unsatisfied performance obligations of $117,185. The Company expects to recognize revenue on approximately 55% to 60% of the remaining performance obligations within one year, 10% to 15% in one to two years and the remaining beyond two years.
NOTE 3 – INVESTMENTS:
Investments consist of certificates of deposits with financial institutions. All investments have original maturities of greater than three months and less than one year and are classified as held-to-maturity, as the Company believes it has the intent and ability to hold the securities to maturity. Investments are stated at amortized cost which approximates fair value. All investments held by the Company at June 30, 2019 are scheduled to mature on or before December 3, 2019.
NOTE 4 – INVENTORIES:
Inventories are stated at the lower of cost or net realizable value, using the average cost method.
Major classifications of inventories are as follows:
|
|
|
June 30, |
|
|
March 31, |
|
||
|
|
|
2019 |
|
|
2019 |
|
||
|
Raw materials and supplies |
|
$ |
2,709 |
|
|
$ |
2,787 |
|
|
Work in process |
|
|
20,313 |
|
|
|
20,553 |
|
|
Finished products |
|
|
1,070 |
|
|
|
1,330 |
|
|
Total |
|
$ |
24,092 |
|
|
$ |
24,670 |
|
NOTE 5 – ASSETS AND LIABILITIES HELD FOR SALE:
In March 2019, the Company's Board of Directors approved a plan to sell Energy Steel. Energy Steel met all of the criteria to classify its assets and liabilities as held for sale at March 31, 2019. The disposal of Energy Steel did not represent a strategic shift that would have a major effect on the Company’s operations and financial results and was, therefore, not classified as discontinued operations in accordance with ASU 2014-08, "Presentation of Financial Statements (Topic 205) and Property, Plant, and Equipment (Topic 360): Reporting Discontinued Operation And Disclosures of Disposals Of Components Of An Entity." As part of the required assessment under the held for sale guidance, the Company determined that the approximate fair value less costs to sell the operations was less than its carrying value and, as a result, an impairment loss totaling $6,449 was recorded in fiscal 2019.
On June 24, 2019, the Company completed the sale of Energy Steel to Hayward Tyler, a division of Avingtrans PLC, a global leader in performance-critical pumps and motors for the energy sector. Under the terms of the stock purchase agreement, the Company received proceeds of $602, subject to a certain adjustments, including a customary working capital adjustment that is expected to be finalized within 90 days of the sale. In addition, $202 of Energy Steel’s net accounts receivable was assigned to the Company. The Company recognized a loss on the disposal of $87 in the first quarter of fiscal 2020. As of June 24, 2019, all of the Energy Steel assets and liabilities were legally transferred, and therefore, are not included in the Company’s Condensed Consolidated Balance Sheet at June 30, 2019.
The following table reconciles the major classes of assets and liabilities classified as held for sale in the Condensed Consolidated Balance Sheet at March 31, 2019:
11
|
|
March 31, 2019 |
|
||
|
|
|
|
|
|
|
Major classes of assets included as held for sale |
|
|
|
|
|
Cash |
|
$ |
552 |
|
|
Trade accounts receivable, net of allowances |
|
|
1,921 |
|
|
Unbilled revenue |
|
|
302 |
|
|
Inventories |
|
|
1,809 |
|
|
Prepaid expenses and other current assets |
|
|
130 |
|
|
Income taxes receivable |
|
|
10 |
|
|
Deferred tax asset |
|
|
126 |
|
|
Total major classes of assets included as held for sale |
|
$ |
4,850 |
|
|
|
|
|
|
|
|
Major classes of liabilities included as held for sale |
|
|
|
|
|
Accounts payable |
|
$ |
520 |
|
|
Accrued compensation |
|
|
326 |
|
|
Accrued expenses and other current liabilities |
|
|
746 |
|
|
Customer deposits |
|
|
1,933 |
|
|
Total major classes of liabilities included as held for sale |
|
$ |
3,525 |
|
NOTE 6 – EQUITY-BASED COMPENSATION:
The Amended and Restated 2000 Graham Corporation Incentive Plan to Increase Shareholder Value, as approved by the Company’s stockholders at the Annual Meeting on July 28, 2016, provides for the issuance of up to 1,375 shares of common stock in connection with grants of incentive stock options, non-qualified stock options, stock awards and performance awards to officers, key employees and outside directors; provided, however, that no more than 467 shares of common stock may be used for awards other than stock options. Stock options may be granted at prices not less than the fair market value at the date of grant and expire no later than ten years after the date of grant.
Restricted stock awards granted in the three-month periods ended June 30, 2019 and 2018 were 83 and 53, respectively. Restricted shares of 40 and 27 granted to officers in fiscal 2020 and fiscal 2019, respectively, vest 100% on the third anniversary of the grant date subject to the satisfaction of the performance metrics for the applicable three-year period. Restricted shares of 28 and 20 granted to officers and key employees in fiscal 2020 and fiscal 2019, respectively, vest 33⅓% per year over a three-year term. Restricted shares of 15 and 6 granted to directors in fiscal 2020 and fiscal 2019, respectively, vest 100% on the first year anniversary of the grant date. No stock option awards were granted in the three-month periods ended June 30, 2019 and 2018.
During the three months ended June 30, 2019 and 2018, the Company recognized equity-based compensation costs related to restricted stock awards of $87 and $260, respectively. The income tax benefit recognized related to equity-based compensation was $20 and $58 for the three months ended June 30, 2019 and 2018, respectively.
The Company has an Employee Stock Purchase Plan (the "ESPP"), which allows eligible employees to purchase shares of the Company's common stock at a discount of up to 15% of its fair market value on the (1) last, (2) first or (3) lower of the last or first day of the six-month offering period. A total of 200 shares of common stock may be purchased under the ESPP. During each of the three months ended June 30, 2019 and 2018, no equity-based compensation costs were recognized related to the ESPP.
12
Basic income per share is computed by dividing net income by the weighted average number of common shares outstanding for the period. Diluted income per share is calculated by dividing net income by the weighted average number of common shares outstanding and, when applicable, potential common shares outstanding during the period. A reconciliation of the numerators and denominators of basic and diluted income per share is presented below:
|
|
|
Three Months Ended |
|
|||||
|
|
|
June 30, |
|
|||||
|
|
|
2019 |
|
|
2018 |
|
||
|
Basic income per share |
|
|
|
|
|
|
|
|
|
Numerator: |
|
|
|
|
|
|
|
|
|
Net income |
|
$ |
82 |
|
|
$ |
2,323 |
|
|
Denominator: |
|
|
|
|
|
|
|
|
|
Weighted average common shares outstanding |
|
|
9,855 |
|
|
|
9,790 |
|
|
Basic income per share |
|
$ |
.01 |
|
|
$ |
.24 |
|
|
Diluted income per share |
|
|
|
|
|
|
|
|
|
Numerator: |
|
|
|
|
|
|
|
|
|
Net income |
|
$ |
82 |
|
|
$ |
2,323 |
|
|
Denominator: |
|
|
|
|
|
|
|
|
|
Weighted average common shares outstanding |
|
|
9,855 |
|
|
|
9,790 |
|
|
Stock options outstanding |
|
|
3 |
|
|
|
14 |
|
|
Weighted average common and potential common shares outstanding |
|
|
9,858 |
|
|
|
9,804 |
|
|
Diluted income per share |
|
$ |
.01 |
|
|
$ |
.24 |
|
Options to purchase a total of 4 and 2 shares of common stock were outstanding at June 30, 2019 and 2018, respectively, but were not included in the above computation of diluted income per share given their exercise prices as they would not be dilutive upon issuance.
NOTE 8 – PRODUCT WARRANTY LIABILITY:
The reconciliation of the changes in the product warranty liability is as follows:
|
|
|
Three Months Ended |
|
|||||
|
|
|
June 30, |
|
|||||
|
|
|
2019 |
|
|
2018 |
|
||
|
Balance at beginning of period |
|
$ |
366 |
|
|
$ |
493 |
|
|
Expense for product warranties |
|
|
27 |
|
|
|
48 |
|
|
Product warranty claims paid |
|
|
(35 |
) |
|
|
(49 |
) |
|
Balance at end of period |
|
$ |
358 |
|
|
$ |
492 |
|
The product warranty liability is included in the line item "Accrued expenses and other current liabilities" in the Condensed Consolidated Balance Sheets.
NOTE 9 – LEASES:
The Company accounts for leases in accordance with Accounting Standard Codification 842, "Leases," which it adopted on April 1, 2019 using the modified retrospective approach. See Note 16 to the Condensed Consolidated Financial Statements for further discussion of this adoption.
The Company leases certain manufacturing facilities, office space, machinery and office equipment. An arrangement is considered to contain a lease if it conveys the right to use and control an identified asset for a period of time in exchange for consideration. If it is determined that an arrangement contains a lease, then a classification of a lease as operating or finance is
13
determined by evaluating the five criteria outlined in the lease accounting guidance at inception. Leases generally have remaining terms of one year to five years, whereas leases with an initial term of twelve months or less are not recorded on the Condensed Consolidated Balance Sheets. The depreciable life of leased assets related to finance leases are limited by the expected term of the lease, unless there is a transfer of title or purchase option that the Company believes is reasonably certain of exercise. Certain leases include options to renew or terminate. Renewal options are exercisable per the discretion of the Company and vary based on the nature of each lease. The term of the lease includes renewal periods only if the Company is reasonably certain that it will exercise the renewal option. When determining if a renewal option is reasonably certain of being exercised, the Company considers several factors, including but not limited to, the cost of moving to another location, the cost of disruption of operations, whether the purpose or location of the leased asset is unique and the contractual terms associated with extending the lease. The Company’s lease agreements do not contain any residual value guarantees or any material restrictive covenants and the Company does not sublease to any third parties. As of June 30, 2019, the Company did not have any material leases that have been signed but not commenced.
Right-of-use (“ROU”) lease assets and lease liabilities are recognized based on the present value of the future minimum lease payments over the lease term at commencement date. ROU assets represent the Company’s right to use an underlying asset for the lease term and lease liabilities represent the Company’s obligation to make payments in exchange for that right of use. Finance lease ROU assets and operating lease ROU assets are included in the line items “Property, plant and equipment, net” and “Operating lease assets”, respectively, in the Condensed Consolidated Balance Sheets. The current portion and non-current portion of finance and operating lease liabilities are all presented separately in the Condensed Consolidated Balance Sheets.
The discount rate implicit within the Company’s leases is generally not readily determinable, and therefore, the Company uses an incremental borrowing rate in determining the present value of lease payments based on rates available at commencement.
The weighted average remaining lease term and discount rate for finance and operating leases are as follows:
|
|
|
June 30, |
|
|
|
|
|
2019 |
|
|
|
Finance Leases |
|
|
|
|
|
Weighted-average remaining lease term in years |
|
|
1.93 |
|
|
Weighted-average discount rate |
|
|
9.27 |
% |
|
|
|
|
|
|
|
Operating Leases |
|
|
|
|
|
Weighted-average remaining lease term in years |
|
|
2.44 |
|
|
Weighted-average discount rate |
|
|
5.50 |
% |
The components of lease expense are as follows:
|
|
|
Three Months Ended |
|
|
|
|
|
June 30, |
|
|
|
|
|
2019 |
|
|
|
Finance lease cost: |
|
|
|
|
|
Amortization of right-of-use assets |
|
$ |
25 |
|
|
Interest on lease liabilities |
|
|
3 |
|
|
Operating lease cost |
|
|
109 |
|
|
Short-term lease cost |
|
|
11 |
|
|
Total lease cost |
|
$ |
148 |
|
Operating lease costs during the three months ended June 30, 2019 were included within cost of sales and selling, general and administrative expenses.
As of June 30, 2019, future minimum payments required under non-cancelable leases are:
14
|
|
Operating Leases |
|
|
Finance Leases |
|
|||
|
Remainder of 2019 |
|
$ |
80 |
|
|
$ |
49 |
|
|
2020 |
|
|
120 |
|
|
|
48 |
|
|
2021 |
|
|
48 |
|
|
|
26 |
|
|
2022 |
|
|
32 |
|
|
|
26 |
|
|
2023 |
|
|
7 |
|
|
|
11 |
|
|
2024 |
|
|
— |
|
|
|
— |
|
|
Total lease payments |
|
|
287 |
|
|
|
160 |
|
|
|
|
|
|
|
|
|
|
|
|
Less – amount representing interest |
|
|
21 |
|
|
|
24 |
|
|
Present value of net minimum lease payments |
|
$ |
266 |
|
|
$ |
136 |
|
The Company’s future minimum lease commitments for operating leases as of March 31, 2019 for the fiscal years 2020 through 2024 were $501, $301, $37, $32, and $8, respectively. Future minimum lease commitments for finance leases as of March 31, 2019 for the fiscal years 2020 through 2024 were $62, $47, $26, $26, and $11, respectively.
ROU assets obtained in exchange for new operating lease liabilities were $143 in the three months ended June 30, 2019.
NOTE 10 – CASH FLOW STATEMENT:
Interest paid was $3 and $2 in the three-month periods ended June 30, 2019 and 2018. Income taxes paid for the three months ended June 30, 2019 and 2018 were $10 and $16, respectively.
At June 30, 2019 and 2018, there were $58 and $29, respectively, of capital purchases that were recorded in accounts payable and are not included in the caption "Purchase of property, plant and equipment" in the Condensed Consolidated Statements of Cash Flows.
NOTE 11 – EMPLOYEE BENEFIT PLANS:
The components of pension cost are as follows:
|
|
|
Three Months Ended |
|
|||||
|
|
|
June 30, |
|
|||||
|
|
|
2019 |
|
|
2018 |
|
||
|
Service cost |
|
$ |
124 |
|
|
$ |
143 |
|
|
Interest cost |
|
|
323 |
|
|
|
335 |
|
|
Expected return on assets |
|
|
(664 |
) |
|
|
(766 |
) |
|
Amortization of actuarial loss |
|
|
242 |
|
|
|
212 |
|
|
Net pension (income) cost |
|
$ |
25 |
|
|
$ |
(76 |
) |
The Company made no contributions to its defined benefit pension plan during the three months ended June 30, 2019 and does not expect to make any contributions to the plan for the balance of fiscal 2020.
The components of the postretirement benefit cost are as follows:
|
|
|
Three Months Ended |
|
|||||
|
|
|
June 30, |
|
|||||
|
|
|
2019 |
|
|
2018 |
|
||
|
Interest cost |
|
$ |
5 |
|
|
$ |
6 |
|
|
Amortization of actuarial loss |
|
|
7 |
|
|
|
7 |
|
|
Net postretirement benefit cost |
|
$ |
12 |
|
|
$ |
13 |
|
The Company paid benefits of $1 related to its postretirement benefit plan during the three months ended June 30, 2019. The Company expects to pay benefits of approximately $77 for the balance of fiscal 2020.
15
The components of net periodic benefit cost other than service cost are included in the line item “Other income” in the Condensed Consolidated Statements of Income and Retained Earnings.
The Company self-funds the medical insurance coverage it provides to its U.S. based employees. The Company maintains a stop loss insurance policy in order to limit its exposure to claims. The liability of $98 and $150 on June 30, 2019 and March 31, 2019, respectively, related to the self-insured medical plan is primarily based upon claim history and is included in the caption “Accrued compensation” as a current liability in the Condensed Consolidated Balance Sheets.
NOTE 12 – COMMITMENTS AND CONTINGENCIES:
The Company has been named as a defendant in lawsuits alleging personal injury from exposure to asbestos allegedly contained in, or accompanying, products made by the Company. The Company is a co-defendant with numerous other defendants in these lawsuits and intends to vigorously defend itself against these claims. The claims in the Company’s current lawsuits are similar to those made in previous asbestos-related suits that named the Company as a defendant, which either were dismissed when it was shown that the Company had not supplied products to the plaintiffs’ places of work or were settled for immaterial amounts. The Company cannot provide any assurances that any pending or future matters will be resolved in the same manner as previous lawsuits.
As of June 30, 2019, the Company was subject to the claims noted above, as well as other legal proceedings and potential claims that have arisen in the ordinary course of business.
Although the outcome of the lawsuits, legal proceedings or potential claims to which the Company is, or may become, a party to cannot be determined and an estimate of the reasonably possible loss or range of loss cannot be made, management does not believe that the outcomes, either individually or in the aggregate, will have a material effect on the Company’s results of operations, financial position or cash flows.
NOTE 13 – INCOME TAXES:
The Company files federal and state income tax returns in several domestic and international jurisdictions. In most tax jurisdictions, returns are subject to examination by the relevant tax authorities for a number of years after the returns have been filed. The Company is subject to U.S. federal examination for the tax years 2015 through 2018 and examination in state tax jurisdictions for the tax years 2014 through 2018. The Company is subject to examination in the People’s Republic of China for tax years 2015 through 2018.
There was no liability for unrecognized tax benefits at either June 30, 2019 or March 31, 2019..
NOTE 14 – CHANGES IN ACCUMULATED OTHER COMPREHENSIVE LOSS:
The changes in accumulated other comprehensive loss by component for the three months ended June 30, 2019 and 2018 are as follows:
|
|
|
Pension and Other Postretirement Benefit Items |
|
|
Foreign Currency Items |
|
|
Total |
|
|||
|
Balance at April 1, 2019 |
|
$ |
(8,947 |
) |
|
$ |
114 |
|
|
$ |
(8,833 |
) |
|
Other comprehensive loss before reclassifications |
|
|
— |
|
|
|
(87 |
) |
|
|
(87 |
) |
|
Amounts reclassified from accumulated other comprehensive loss |
|
|
194 |
|
|
|
— |
|
|
|
194 |
|
|
Net current-period other comprehensive income (loss) |
|
|
194 |
|
|
|
(87 |
) |
|
|
107 |
|
|
Balance at June 30, 2019 |
|
$ |
(8,753 |
) |
|
$ |
27 |
|
|
$ |
(8,726 |
) |
16
|
|
|
Pension and Other Postretirement Benefit Items |
|
|
Foreign Currency Items |
|
|
Total |
|
|||
|
Balance at April 1, 2018 |
|
$ |
(8,599 |
) |
|
$ |
349 |
|
|
$ |
(8,250 |
) |
|
Other comprehensive loss before reclassifications |
|
|
— |
|
|
|
(199 |
) |
|
|
(199 |
) |
|
Amounts reclassified from accumulated other comprehensive loss |
|
|
170 |
|
|
|
— |
|
|
|
170 |
|
|
Net current-period other comprehensive income (loss) |
|
|
170 |
|
|
|
(199 |
) |
|
$ |
(29 |
) |
|
Balance at June 30, 2018 |
|
$ |
(8,429 |
) |
|
$ |
150 |
|
|
$ |
(8,279 |
) |
The reclassifications out of accumulated other comprehensive loss by component for the three months ended June 30, 2019 and 2018 are as follows:
|
Details about Accumulated Other Comprehensive Loss Components |
|
Amount Reclassified from Accumulated Other Comprehensive Loss |
|
|
|
Affected Line Item in the Condensed Consolidated Statements of Operations and Retained Earnings |
||||||
|
|
|
|
|
|
|
|
||||||
|
|
|
June 30, |
|
|
|
|
||||||
|
|
|
2019 |
|
|
|
2018 |
|
|
|
|
||
|
Pension and other postretirement benefit items: |
|
|
|
|
|
|
|
|
|
|
|
|
|
Amortization of actuarial loss |
|
$ |
(249 |
) |
(1) |
|
$ |
(219 |
) |
(1) |
|
Income before provision for income taxes |
|
|
|
|
(55 |
) |
|
|
|
(49 |
) |
|
|
Provision for income taxes |
|
|
|
$ |
(194 |
) |
|
|
$ |
(170 |
) |
|
|
Net income |
|
(1) |
These accumulated other comprehensive loss components are included within the computation of pension and other postretirement benefit costs. See Note 11. |
NOTE 15 – OTHER EXPENSE:
On June 24, 2019, the Company sold Energy Steel and recognized a loss on the sale of $87. See Note 5 to the Condensed Consolidated Financial Statements for further discussion of the sale. In addition, during the first quarter of fiscal 2019, the Company incurred a bad debt charge of $98 and an inventory write down of $338 related to the bankruptcy of Westinghouse Electric Company. All of these items are included in the line item “Other expense” in the Condensed Consolidated Statement of Income and Retained Earnings for the three months ended June 30, 2019.
NOTE 16 – ACCOUNTING AND REPORTING CHANGES:
In the normal course of business, management evaluates all new accounting pronouncements issued by the Financial Accounting Standards Board ("FASB"), the Securities and Exchange Commission, the Emerging Issues Task Force, the American Institute of Certified Public Accountants or any other authoritative accounting bodies to determine the potential impact they may have on the Company's consolidated financial statements.
In February 2016, the FASB issued Accounting Standards Update ("ASU") No. 2016-02, "Leases (Topic 842)," which requires companies to recognize all leases as assets and liabilities on the consolidated balance sheet. Lessees are permitted to make an accounting policy election to not recognize an asset and liability for leases with a term of twelve months or less. This ASU retains a distinction between finance leases and operating leases, and the classification criteria for distinguishing between finance leases and operating leases are substantially similar to the classification criteria for distinguishing between capital leases and operating leases in the previous accounting guidance. The guidance is effective for fiscal years beginning after December 15, 2018, including interim periods within those fiscal years. Earlier application is permitted.
The Company adopted the new standard using the modified retrospective approach on April 1, 2019. The Company elected the available transition method that uses the effective date of the amended guidance as the date of initial application. The guidance provided for several practical expedients. The Company elected the package of practical expedients permitted under the transition guidance which allows entities to carry forward historical lease classification. The Company made an accounting policy election to not recognize an asset and liability for leases with a term of twelve months or less. The Company recognizes those lease payments in the Condensed Consolidated Statements of Income and Retained Earnings on a straight-line basis over the lease term. On April 1, 2019, the Company recognized the cumulative effect of initially applying the amended guidance which resulted in the recognition of operating lease ROU assets of $676, lease liabilities of $732 and a decrease to the opening balance of retained earnings of $80. Other
17
current assets and the deferred income tax liability were reduced by $47 and $20, respectively. Approximately $500 of ROU assets and lease liabilities were related to the business held for sale at March 31, 2019 and subsequently sold on June 24, 2019. See Note 9 to the Condensed Consolidated Financial Statements for additional information on the Company’s leases.
Management does not expect any other recently issued accounting pronouncements, which have not already been adopted, to have a material impact on the Company's consolidated financial statements.
18
Item 2.Management’s Discussion and Analysis of Financial Condition and Results of Operations
(Dollar amounts in thousands, except per share data)
Overview
We are a global business that designs, manufactures and sells critical equipment for the energy, defense and chemical/petrochemical industries. Our energy markets include oil refining, cogeneration, and alternative power. For the defense industry, our equipment is used in nuclear propulsion power systems for the U.S. Navy. For the chemical and petrochemical industries, our equipment is used in fertilizer, ethylene, methanol and downstream chemical facilities.
Our global brand is built upon our world-renowned engineering expertise in vacuum and heat transfer technology, responsive and flexible service and high quality standards. We design and manufacture custom-engineered ejectors, vacuum pumping systems, surface condensers and vacuum systems. Our equipment can also be found in other diverse applications such as metal refining, pulp and paper processing, water heating, refrigeration, desalination, food processing, pharmaceutical, and heating, ventilating and air conditioning.
Our corporate headquarters are located in Batavia, New York. We have production facilities co-located with our headquarters in Batavia. We also have a wholly-owned foreign subsidiary, Graham Vacuum and Heat Transfer Technology (Suzhou) Co., Ltd. ("GVHTT"), located in Suzhou, China. GVHTT provides sales and engineering support for us in the People's Republic of China and management oversight throughout Southeast Asia. In the third quarter of fiscal 2019, we established Graham India Private Limited ("GIPL") as a wholly-owned subsidiary. GIPL, located in Ahmedabad, India, serves as a sales and market development office focusing on the refining, petrochemical and fertilizer markets.
In the first quarter of fiscal 2020, we completed the sale of our commercial nuclear business, Energy Steel and Supply Co. ("Energy Steel").
Our current fiscal year (which we refer to as "fiscal 2020") ends March 31, 2020.
Highlights
Highlights for the three months ended June 30, 2019 include:
|
|
• |
Net sales for the first quarter of fiscal 2020 were $20,593 down 30% compared with $29,551 for the first quarter of the fiscal year ended March 31, 2019 (which we refer to as "fiscal 2019"). |
|
|
• |
Net income and income per diluted share for the first quarter of fiscal 2020 were $82 and $0.01 compared with $2,323 and $0.24, respectively, for the first quarter of fiscal 2019. Excluding the results for our commercial nuclear business as well as the costs related to the sale of that business, net income and income per diluted share for the first quarter of fiscal 2020 were $982 and $0.10, compared with $2,722 and $0.28, respectively, for the first quarter of fiscal 2019. |
|
|
• |
Orders booked in the first quarter of fiscal 2020 were $15,089, compared with the first quarter of fiscal 2019 when orders booked were $21,977. |
|
|
• |
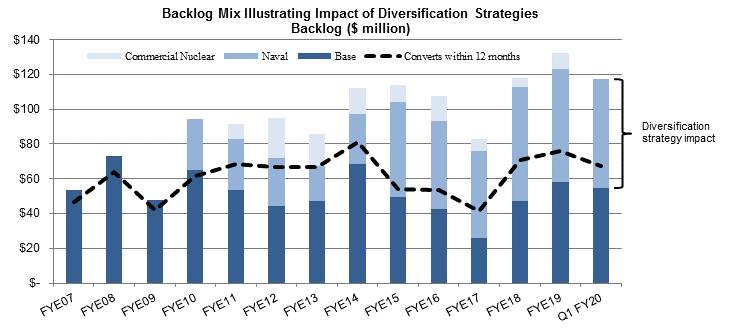
Backlog was $117,185 at June 30, 2019, compared with $132,127 at March 31, 2019 and $114,855 on June 30, 2018. The backlog on June 30, 2019 was reduced by $9,777 due to the sale of our commercial nuclear business. |
|
|
• |
Gross profit margin and operating margin for the first quarter of fiscal 2020 were 23% and (2%), respectively, compared with 24% and 9%, respectively, for the first quarter of fiscal 2019. Excluding the results of the commercial nuclear business, gross profit margin and operating margin for the first quarter of fiscal 2020 were 24% and 4%, respectively, compared with 26% and 11%, respectively, for the first quarter of fiscal 2019. |
|
|
• |
Cash and short-term investments at June 30, 2019 were $72,557, compared with $77,753 on March 31, 2019. |
Forward-Looking Statements
This report and other documents we file with the Securities and Exchange Commission include "forward-looking statements" within the meaning of Section 27A of the Securities Act of 1933, as amended, and Section 21E of the Securities Exchange Act of 1934, as amended.
19
These statements involve known and unknown risks, uncertainties and other factors that may cause actual results to be materially different from any future results implied by the forward-looking statements. Such factors include, but are not limited to, the risks and uncertainties identified by us under the heading "Risk Factors" in Item 1A of our Annual Report on Form 10-K for fiscal 2019.
Forward-looking statements may also include, but are not limited to, statements about:
|
|
• |
the current and future economic environments affecting us and the markets we serve; |
|
|
• |
expectations regarding investments in new projects by our customers; |
|
|
• |
sources of revenue and anticipated revenue, including the contribution from anticipated growth; |
|
|
• |
expectations regarding achievement of revenue and profitability; |
|
|
• |
plans for future products and services and for enhancements to existing products and services; |
|
|
• |
our operations in foreign countries; |
|
|
• |
political instability in regions in which our customers are located; |
|
|
• |
tariffs and trade relations between the United States and its trading partners; |
|
|
• |
our ability to affect our growth and acquisition strategy; |
|
|
• |
our ability to maintain or expand work for the U.S. Navy; |
|
|
• |
our ability to successfully execute our existing contracts; |
|
|
• |
estimates regarding our liquidity and capital requirements; |
|
|
• |
timing of conversion of backlog to sales; |
|
|
• |
our ability to attract or retain customers; |
|
|
• |
the outcome of any existing or future litigation; and |
|
|
• |
our ability to increase our productivity and capacity. |
Forward-looking statements are usually accompanied by words such as "anticipate," "believe," "estimate," "may," "might," "intend," "interest," "appear," "expect," "suggest," "plan," "predict," "project," "should," "will," "encourage," "potential," "contemplate," "continue," "could" and similar expressions. Actual results could differ materially from historical results or those implied by the forward-looking statements contained in this report.
Undue reliance should not be placed on our forward-looking statements. Except as required by law, we undertake no obligation to update or announce any revisions to forward-looking statements contained in this report, whether as a result of new information, future events or otherwise.
Current Market Conditions
Our global energy and petrochemical markets continue to show improvement in fiscal 2020. Improvement in general global economic conditions has led to increased activity by our customers in the downstream energy sector. Customers are investing in upgrading and turnaround maintenance for existing facilities and, in certain geographies, are looking at new capacity. While this additional activity continues to be encouraging, we cannot predict the pace and longevity of the market improvement.
Our long-term view for the global energy and petrochemical markets is that general economic fundamentals will drive increasing demand and result in continued capital investment to satisfy increasing global energy demand. These fundamentals include rising populations, strong emerging market economic growth, and overall global economic expansion. However, the energy markets we serve will also by impacted by increased use of renewable energy sources and conservation.
Our naval nuclear propulsion market has demand tied to aircraft carrier and submarine vessel construction schedules of the primary shipyards that service the U.S. Navy. We expect growth in our naval nuclear propulsion business to result from our strategic actions to increase our market share, our successful performance, and expected increases in demand.
We believe the long-term outlook in our key markets supports our growth plans. In the near term, new order levels are expected to remain variable, resulting in both relatively strong and weak periods. We believe, however, order activity will continue to improve through the rest of fiscal 2020, and potentially beyond.
20
The chart below shows the impact of our diversification strategy. Over half of our current backlog is from markets not served by us in the fiscal 2007-2009 time frame. Included in the graph for prior periods, but not the first quarter of fiscal 2020 ("Q1 FY20" below) is the backlog for our commercial nuclear business which was divested in June 2019. At the end of fiscal 2019 ("FYE19" below), this backlog was $8,039.
*Note: FYE refers to fiscal year ended March 31
Results of Operations
To better understand the significant factors that influenced our performance during the periods presented, the following discussion should be read in conjunction with our Condensed Consolidated Financial Statements and the notes to our Condensed Consolidated Financial Statements included in Part I, Item 1, of this Quarterly Report on Form 10-Q.
The following table summarizes our results of operations for the periods indicated:
|
|
|
Three Months Ended |
|
|||||
|
|
|
June 30, |
|
|||||
|
|
|
2019 |
|
|
2018 |
|
||
|
Net sales |
|
$ |
20,593 |
|
|
$ |
29,551 |
|
|
Gross profit |
|
$ |
4,714 |
|
|
$ |
7,142 |
|
|
Gross profit margin |
|
|
23 |
% |
|
|
24 |
% |
|
SG&A expense (1) |
|
$ |
4,567 |
|
|
$ |
4,610 |
|
|
SG&A as a percent of sales |
|
|
22 |
% |
|
|
16 |
% |
|
Net income |
|
$ |
82 |
|
|
$ |
2,323 |
|
|
Diluted income per share |
|
$ |
0.01 |
|
|
$ |
0.24 |
|
|
Total assets |
|
$ |
145,331 |
|
|
$ |
149,353 |
|
|
Total assets excluding cash, cash equivalents and investments |
|
$ |
72,774 |
|
|
$ |
74,065 |
|
|
|
(1) |
Selling, general and administrative expense is referred to as "SG&A". |
21
The following table reconciles gross margin to adjusted gross margin for the periods indicated:
|
|
|
Three Months Ended June 30, |
|
|||||
|
|
|
2019 |
|
|
2018 |
|
||
|
Revenue |
|
$ |
20,593 |
|
|
$ |
29,551 |
|
|
- Revenue of commercial nuclear utility business |
|
|
(1,276 |
) |
|
|
(2,922 |
) |
|
Adjusted revenue |
|
$ |
19,317 |
|
|
$ |
26,629 |
|
|
|
|
|
|
|
|
|
|
|
|
Gross profit |
|
$ |
4,714 |
|
|
$ |
7,142 |
|
|
- Gross profit of commercial nuclear utility business |
|
|
(41 |
) |
|
|
(137 |
) |
|
Adjusted gross profit |
|
$ |
4,673 |
|
|
$ |
7,005 |
|
|
Adjusted gross margin |
|
|
24.2 |
% |
|
|
26.3 |
% |
The following table reconciles operating margin to adjusted operating margin for the periods indicated:
|
|
|
Three Months Ended June 30, |
|
|||||
|
|
|
2019 |
|
|
2018 |
|
||
|
Revenue |
|
$ |
20,593 |
|
|
$ |
29,551 |
|
|
- Revenue of commercial nuclear utility business |
|
|
(1,276 |
) |
|
|
(2,922 |
) |
|
Adjusted revenue |
|
$ |
19,317 |
|
|
$ |
26,629 |
|
|
|
|
|
|
|
|
|
|
|
|
Operating (loss) profit |
|
$ |
(376 |
) |
|
$ |
2,532 |
|
|
+ Loss on sale of commercial nuclear utility business |
|
|
87 |
|
|
|
— |
|
|
+ Operating loss of commercial nuclear utility business |
|
|
1,016 |
|
|
|
498 |
|
|
Adjusted operating profit |
|
$ |
727 |
|
|
$ |
3,030 |
|
|
Adjusted operating margin |
|
|
3.8 |
% |
|
|
11.4 |
% |
The following table reconciles net income to adjusted net income for the periods indicated:
|
|
|
Three Months Ended June 30, |
|
|||||||||||||||||||||||||||
|
|
|
2019 |
|
|
2018 |
|
||||||||||||||||||||||||
|
|
|
|
|
|
|
Per Diluted Share |
|
|
|
|
|
|
Per Diluted Share |
|
||||||||||||||||
|
Net income |
|
$ |
82 |
|
|
$ |
0.01 |
|
|
$ |
2,323 |
|
|
$ |
0.24 |
|
||||||||||||||
|
+ Loss on sale of commercial nuclear utility business |
|
|
87 |
|
|
|
0.01 |
|
|
|
— |
|
|
|
— |
|
||||||||||||||
|
+ Operating loss of commercial nuclear utility business |
|
|
1,016 |
|
|
|
0.10 |
|
|
|
498 |
|
|
|
0.05 |
|
||||||||||||||
|
- Tax effect of above |
|
|
(203 |
) |
|
|
(0.02 |
) |
|
|
(99 |
) |
|
|
(0.01 |
) |
||||||||||||||
|
Adjusted net income |
|
$ |
982 |
|
|
$ |
0.10 |
|
|
$ |
2,722 |
|
|
$ |
0.28 |
|
||||||||||||||
The First Quarter of Fiscal 2020 Compared With the First Quarter of Fiscal 2019
Sales for the first quarter of fiscal 2020 were $20,593, a 30% decrease from sales of $29,551 for the first quarter of fiscal 2019. Included in the first quarter of fiscal 2020 and fiscal 2019 was sales of $1,276 and $2,922, respectively, from our commercial nuclear business which was sold in the quarter. Our domestic sales, as a percentage of aggregate sales, were 70% in the first quarter of fiscal 2020 compared with 46% in the first quarter of fiscal 2019. Domestic sales increased $995 in the first quarter of fiscal 2020, or 7% year-over-year. International sales decreased $9,953, or 62%, in the first quarter of fiscal 2020 compared with the first quarter of fiscal 2019. The decrease in international sales was driven primarily by a large refining project in Canada which was included in fiscal 2019 sales. Sales in the three months ended June 30, 2019 were 36% to the refining industry, 35% to the chemical and petrochemical industries, 7% to the power industry, most of which was to the commercial nuclear market, and 22% to other commercial and industrial applications, including the U.S. Navy. Sales in the three months ended June 30, 2018 were 67% to the refining industry, 10% to the chemical and petrochemical industries, 11% to the power industry, including the commercial nuclear market, and 12% to other commercial and industrial applications, including the U.S. Navy. Fluctuation in sales among markets, products and geographic locations varies, sometimes significantly, from quarter-to-quarter based on timing and magnitude of projects.
22
See also "Current Market Conditions," above. For additional information on anticipated future sales and our markets, see "Orders and Backlog" below.
Gross profit margin and operating margin for the first quarter of fiscal 2020 were 23% and (2%), respectively. Excluding the commercial nuclear business as well as the costs associated with selling it, gross profit margin and operating margin for the first quarter of fiscal 2020 were 24% and 4%, respectively. Gross profit for the first quarter of fiscal 2020 decreased 34% compared with fiscal 2019, to $4,714 from $7,142. Gross profit was lower due to lower revenue.
SG&A expenses as a percent of sales for the three-month periods ended June 30, 2019 and 2018 were 22% and 16%, respectively. SG&A expenses in the first quarter of fiscal 2020 were $4,567, a decrease of $43, or 1%, compared with the first quarter of fiscal 2019 SG&A of $4,610.
Interest income for the three-month periods ended June 30, 2019 and 2018 was $399 and $289, respectively. The increase in interest income is due to higher market investment rates compared with rates a year ago. Interest expense was $3 for the quarter ended June 30, 2019 compared with $2 for the quarter ended June 30, 2018.
Our effective tax rate in the first quarter of fiscal 2020 was 23%, the same as it was in the first quarter of fiscal 2019.
Net income and income per diluted share for the first quarter of fiscal 2020 were $82 and $0.01, respectively, compared with $2,323 and $0.24, respectively, in the first quarter of fiscal 2019. Excluding the results in the first quarter of fiscal 2020 of our commercial nuclear business as well as the costs related to the sale of that business, net income and income per diluted share for the first quarter of fiscal 2020 were $982 and $0.10, respectively, compared with $2,722 and $0.28, respectively, for the first quarter of fiscal 2019.
Liquidity and Capital Resources
The following discussion should be read in conjunction with our Condensed Consolidated Balance Sheets and Statements of Cash Flows:
|
|
|
June 30, |
|
|
March 31, |
|
||
|
|
|
2019 |
|
|
2019 |
|
||
|
Cash and investments |
|
$ |
72,557 |
|
|
$ |
77,753 |
|
|
Working capital |
|
|
79,082 |
|
|
|
79,896 |
|
|
Working capital ratio(1) |
|
|
2.8 |
|
|
|
2.5 |
|
|
Working capital excluding cash and investments |
|
|
6,525 |
|
|
|
2,143 |
|
|
Working capital excluding cash and investments as a percent of net sales(2) |
|
|
7.9 |
% |
|
|
2.3 |
% |
|
|
(1) |
Working capital ratio equals current assets divided by current liabilities. |
|
|
(2) |
Working capital excluding cash and investments as a percent of net sales is based upon trailing twelve month sales. |
Net cash used by operating activities for the first quarter of fiscal 2020 was $4,753 compared with $68 of cash generated for the first quarter of fiscal 2019. The cash usage compared year over year was attributable primarily to inventory, accounts receivable and accrued compensation, partially offset by unbilled revenue.
Dividend payments and capital expenditures in the first quarter of fiscal 2020 were $988 and $294, respectively, compared with $885 and $163, respectively, for the first quarter of fiscal 2019.
Capital expenditures for fiscal 2020 are expected to be between approximately $2,500 and $2,800. Approximately 75% to 80% of our fiscal 2020 capital expenditures are expected to be for machinery and equipment, with the remaining amounts expected to be used for other items.
Cash and investments were $72,557 on June 30, 2019 compared with $77,753 on March 31, 2019, down $5,196. The reduction in cash was due to usage of cash for accounts payable.
We invest net cash generated from operations in excess of cash held for near-term needs in short-term, less than 365 days, certificates of deposit, money market accounts or U.S. government instruments, generally with maturity periods of up to 180 days. Our money market account is used to securitize our outstanding letters of credit, which reduces our cost on those letters of credit. Approximately 95% of our cash and investments are held in the U.S. The remaining 5% is invested in our China operations.
23
Our revolving credit facility with JP Morgan Chase, N.A. ("JP Morgan Chase") provides us with a line of credit of $25,000, including letters of credit and bank guarantees. In addition, our JP Morgan Chase agreement allows us to increase the line of credit, at our discretion, up to another $25,000, for total availability of $50,000. Borrowings under this credit facility are secured by all of our assets. We also have a $5,000 unsecured line of credit with HSBC, N.A. ("HSBC"). Letters of credit outstanding on June 30, 2019 and March 31, 2019 were $7,918 and $8,503, respectively. The outstanding letters of credit as of June 30, 2019 were issued by JP Morgan Chase and HSBC, as well as Bank of America, under our previous credit facility. There were no other amounts outstanding on our credit facilities at June 30, 2019 and March 31, 2019. The borrowing rate under our JP Morgan Chase facility as of June 30, 2019 was the bank’s prime rate, or 5.50%. Availability under the JP Morgan Chase and HSBC lines of credit was $22,667 and $22,505, respectively, at June 30, 2019 and March 31, 2019, respectively. We believe that cash generated from operations, combined with our investments and available financing capacity under our credit facility, will be adequate both to meet our cash needs for the immediate future and to support our growth strategies.
Orders and Backlog
Orders for the three-month period ended June 30, 2019 were $15,089 compared with $21,977 for the same period last year, a decrease of $6,888. Included in the orders for the first three months of fiscal 2020 was $2,996 for the commercial nuclear business, which was sold in the quarter. Orders represent written communications received from customers requesting us to supply products and/or services. Domestic orders were 74% of total orders, or $11,157, and international orders were 26% of total orders, or $3,932, in the first quarter of fiscal 2020 compared with the first quarter of fiscal 2019 when domestic orders were 89%, or $19,525, of total orders, and international orders were 11%, or $2,452, of total orders.
Backlog was $117,185 at June 30, 2019, compared with $132,127 at March 31, 2019, an 11% decrease. The decrease includes $9,777 of backlog for our commercial nuclear business which we sold in June 2019. Backlog is defined as the total dollar value of orders received for which revenue has not yet been recognized. Approximately 55% to 60% of orders currently in our backlog are expected to be converted to sales within one year. The majority of the orders that are expected to convert beyond twelve months are for the U.S. Navy. At June 30, 2019, 21% of our backlog was attributable to equipment for refinery project work, 21% for chemical and petrochemical projects, 54% for U.S. Navy projects and 4% for power and other industrial applications. This split of backlog by end market is comparable to the levels on March 31, 2019. At June 30, 2018, 22% of our backlog was attributable to equipment for refinery project work, 11% for chemical and petrochemical projects, 56% for U.S. Navy projects and 11% for power and other industrial applications. At June 30, 2019, we had no projects on hold.
Outlook
Capital spending in the energy markets we serve began to increase during the second half of fiscal 2018 and this trend has continued. Orders in the chemical and petrochemical market began to increase in fiscal 2019. In general, refining and chemical industry end markets continue to measuredly release orders. While our bidding activity has developed a robust pipeline of potential orders, final investment decisions and order placements by customers remain measured. At June 30, 2019, 54% of our backlog was for the U.S. Navy. Our pipeline continues to be robust, but quarterly fluctuations in order levels are likely to occur.
We continue to believe in the long-term strength of the energy and petrochemical markets. Coupled with our diversification strategy with the U.S. Navy, we believe that the long-term strength of our markets will support our goal to significantly grow our business. We have invested in capacity to serve our commercial customers as well as to expand the work we do for the U.S. Navy. We intend to continue to look for organic growth opportunities as well as acquisitions or other business combinations that we believe will allow us to expand our presence in both our existing and ancillary markets. We are focused on reducing earnings volatility, growing our business and diversifying our business and product lines.
We expect revenue in fiscal 2020 to be approximately $100,000 to $105,000; this excludes our commercial nuclear utility business which was sold in the first quarter of fiscal 2020. This would be an anticipated increase of 20% to 26% when compared with $83,495 for fiscal 2019 when excluding our commercial nuclear business.
We expect gross profit margin in fiscal 2020 to be in the 24% to 26% range, compared with 23.9% in fiscal 2019. SG&A during fiscal 2020 is expected to be between $17,000 and $18,000, excluding the SG&A incurred in the first quarter in our commercial nuclear business. Our effective tax rate during fiscal 2020 is expected to be approximately 20%.
We expect that cash flow in fiscal 2020 will continue to be solid. We continue to believe that the long-term outlook for the energy and petrochemical markets is good and expect we will have more clarity on the strength and durability of the current recovery as we work through fiscal 2020.
24
We have been named as a defendant in lawsuits alleging personal injury from exposure to asbestos allegedly contained in or accompanying our products. We are a co-defendant with numerous other defendants in these lawsuits and intend to vigorously defend ourselves against these claims. The claims in our current lawsuits are similar to those made in previous asbestos lawsuits that named us as a defendant. Such previous lawsuits either were dismissed when it was shown that we had not supplied products to the plaintiffs’ places of work or were settled by us for immaterial amounts.
As of June 30, 2019, we are subject to the claims noted above, as well as other legal proceedings and potential claims that have arisen in the ordinary course of business. Although the outcome of the lawsuits, legal proceedings or potential claims to which we are or may become a party cannot be determined and an estimate of the reasonably possible loss or range of loss cannot be made, we do not believe that the outcomes, either individually or in the aggregate, will have a material effect on our results of operations, financial position or cash flows.
Critical Accounting Policies, Estimates, and Judgments
Our unaudited condensed consolidated financial statements are based on the selection of accounting policies and the application of significant accounting estimates, some of which require management to make significant assumptions. We believe that the most critical accounting estimates used in the preparation of our condensed consolidated financial statements relate to labor hour estimates and establishment of operational milestones which are used to recognize revenue under the overtime recognition model, accounting for contingencies, under which we accrue a loss when it is probable that a liability has been incurred and the amount can be reasonably estimated, and accounting for pensions and other postretirement benefits. For further information, refer to Item 7 "Management's Discussion and Analysis of Financial Condition and Results of Operations" and Item 8 "Financial Statements and Supplementary Data" included in our Annual Report on Form 10-K for the year ended March 31, 2019.
Off Balance Sheet Arrangements
We did not have any off balance sheet arrangements as of June 30, 2019 or March 31, 2019, other than letters of credit.
Item 3. Quantitative and Qualitative Disclosures About Market Risk
The principal market risks (i.e., the risk of loss arising from market changes) to which we are exposed are foreign currency exchange rates, price risk, project cancellation risk and trade policy.
The assumptions applied in preparing the following qualitative and quantitative disclosures regarding foreign currency exchange rate, price risk and project cancellation risk are based upon volatility ranges experienced by us in relevant historical periods, our current knowledge of the marketplace, and our judgment of the probability of future volatility based upon the historical trends and economic conditions of the markets in which we operate.
Foreign Currency
International consolidated sales for the first three months of fiscal 2020 were 30% of total sales compared with 54% for the same period of fiscal 2019. Operating in markets throughout the world exposes us to movements in currency exchange rates. Currency movements can affect sales in several ways, the foremost being our ability to compete for orders against foreign competitors that base their prices on relatively weaker currencies. Business lost due to competition for orders against competitors using a relatively weaker currency cannot be quantified. In addition, cash can be adversely impacted by the conversion of sales made by us in a foreign currency to U.S. dollars. In each of the first three months of fiscal 2020 and fiscal 2019, all sales by us and our wholly-owned subsidiaries, for which we were paid, were denominated in the local currency of the respective subsidiary (U.S. dollars or Chinese RMB).
We have limited exposure to foreign currency purchases. In each of the first three months of fiscal 2020 and 2019, our purchases in foreign currencies represented approximately 2% of the cost of products sold. At certain times, we may enter into forward foreign currency exchange agreements to hedge our exposure against potential unfavorable changes in foreign currency values on significant sales and purchase contracts negotiated in foreign currencies. Forward foreign currency exchange contracts were not used in the periods being reported on in this Quarterly Report on Form 10-Q and as of June 30, 2019 and March 31, 2019, we held no forward foreign currency contracts.
25
Operating in a global marketplace requires us to compete with other global manufacturers which, in some instances, benefit from lower production costs and more favorable economic conditions. Although we believe that our customers differentiate our products on the basis of our manufacturing quality, responsive and flexible service, and engineering experience and excellence, among other things, such lower production costs and more favorable economic conditions mean that certain of our competitors are able to offer products similar to ours at lower prices. The cost of metals and other materials used in our products can experience significant volatility, and as such, can impact our ability to reflect this volatility in our pricing.
Project Cancellation and Project Continuation Risk
Open orders are reviewed continuously through communications with customers. If it becomes evident to us that a project is delayed well beyond its original shipment date, management will move the project into "placed on hold" (i.e. suspended) category. Furthermore, if a project is cancelled by our customer, it is removed from our backlog. We attempt to mitigate the risk of cancellation by structuring contracts with our customers to maximize the likelihood that progress payments made to us for individual projects cover the costs we have incurred. As a result, we do not believe we have a significant cash exposure to projects which may be cancelled. At June 30, 2019, we had no projects on hold.
Item 4.Controls and Procedures
Conclusion regarding the effectiveness of disclosure controls and procedures
Our President and Chief Executive Officer (principal executive officer) and Vice President-Finance & Administration and Chief Financial Officer (principal financial officer) each have evaluated the effectiveness of our disclosure controls and procedures (as defined in Exchange Act Rules 13a-15(e) and 15d-15(e)) as of the end of the period covered by this Quarterly Report on Form 10-Q. Based on such evaluation, and as of such date, our President and Chief Executive Officer and Vice President-Finance & Administration and Chief Financial Officer concluded that our disclosure controls and procedures were effective in all material respects.
Changes in internal control over financial reporting
There has been no change to our internal control over financial reporting during the quarter covered by this Quarterly Report on Form 10-Q that has materially affected, or that is reasonably likely to materially affect, our internal control over financial reporting.
26
GRAHAM CORPORATION AND SUBSIDIARIES
FORM 10-Q
JUNE 30, 2019
PART II - OTHER INFORMATION
Item 2.Unregistered Sales of Equity Securities and Use of Proceeds
Purchase of Equity Securities by the Issuer
During the first quarter of fiscal 2020, we directly withheld shares for tax withholding purposes from restricted stock awarded to officers that vested during the period. Common stock repurchases in the quarter ended June 30, 2019 were as follows:
|
Period |
|
Total Number of Shares Purchased |
|
Average Price Paid Per Share |
|
Total Number of Shares Purchased as Part of Publicly Announced Program |
|
Maximum Number of Shares That May Yet Be Purchased Under the Program |
|
|
|
|
|
|
|
|
|
|
|
4/01/2019 – 4/30/2019 |
|
-- |
|
-- |
|
-- |
|
-- |
|
5/01/2019 – 5/31/2019 |
|
11 |
|
$20.57 |
|
-- |
|
-- |
|
6/01/2019 – 6/30/2019 |
|
-- |
|
-- |
|
-- |
|
-- |
|
Total |
|
11 |
|
$20.57 |
|
-- |
|
-- |
INDEX OF EXHIBITS
|
(10) |
|
Material Contracts |
|
|
|
|
|
|
|
|
|
# |
|
10.1 |
||
|
|
|
|
|
|
|
# |
|
10.2 |
||
|
|
|
|
|
|
|
# |
|
10.3 |
||
|
(31) |
|
Rule 13a-14(a)/15d-14(a) Certifications |
||
|
|
|
|
|
|
|
+ |
|
31.1 |
||
|
|
|
|
|
|
|
+ |
|
31.2 |
||
|
|
|
|
|
|
|
(32) |
|
Section 1350 Certification |
||
|
|
|
|
|
|
|
+ |
|
32.1 |
||
27
|
|
|
|
|
|
|
|
|
|
|
|
|
(101) |
|
Interactive Data File |
||
|
|
|
|
|
|
|
+ |
|
101.INS |
XBRL Instance Document |
|
|
|
|
|
|
|
|
+ |
|
101.SCH |
XBRL Taxonomy Extension Schema Document |
|
|
|
|
|
|
|
|
+ |
|
101.CAL |
XBRL Taxonomy Extension Calculation Linkbase Document |
|
|
|
|
|
|
|
|
+ |
|
101.DEF |
XBRL Taxonomy Extension Definition Linkbase Document |
|
|
|
|
|
|
|
|
+ |
|
101.LAB |
XBRL Taxonomy Extension Label Linkbase Document |
|
|
|
|
|
|
|
|
+ |
|
101.PRE |
XBRL Taxonomy Extension Presentation Linkbase Document |
|
|
|
|
|
|
|
|
|
|
|
|
|
|
|
|
+
# |
Exhibit filed with this report
Management contract or compensation plan |
|
|
|
|
|
|
|
28
Pursuant to the requirements of the Securities Exchange Act of 1934, the registrant has duly caused this report to be signed on its behalf by the undersigned thereunto duly authorized.
|
|
GRAHAM CORPORATION
|
||
|
By: |
|
|
/s/ Jeffrey Glajch |
|
|
|
|
Jeffrey Glajch |
|
|
|
|
Vice President-Finance & Administration and |
|
|
|
|
Chief Financial Officer |
|
|
|
|
(On behalf of the Registrant and as Principal Financial Officer) |
Date: July 30, 2019
29