UNITED STATES
SECURITIES AND EXCHANGE COMMISSION
WASHINGTON, D.C. 20549
FORM
(Mark One)
|
|
QUARTERLY REPORT PURSUANT TO SECTION 13 OR 15(d) OF THE SECURITIES EXCHANGE ACT OF 1934 |
For the quarterly period ended
or
|
|
TRANSITION REPORT PURSUANT TO SECTION 13 OR 15(d) OF THE SECURITIES EXCHANGE ACT OF 1934 |
For the transition period from _____________ to ___________
Commission File Number
(Exact name of registrant as specified in its charter)
|
|
|
|
(State or other jurisdiction of incorporation or organization) |
(I.R.S. Employer Identification No.) |
|
|
|
|
(Address of principal executive offices) |
(Zip Code) |
(Registrant's telephone number, including area code)
Securities registered pursuant to Section 12(b) of the Act:
|
Title of each class |
|
Trading Symbol(s) |
|
Name of each exchange on which registered |
|
|
|
|
|
|
Indicate by check mark whether the registrant (1) has filed all reports required to be filed by Section 13 or 15(d) of the Securities Exchange Act of 1934 during the preceding 12 months (or for such shorter period that the registrant was required to file such reports), and (2) has been subject to such filing requirements for the past 90 days.
Indicate by check mark whether the registrant has submitted electronically every Interactive Data File required to be submitted pursuant to Rule 405 of Regulation S-T (§232.405 of this chapter) during the preceding 12 months (or for such shorter period that the registrant was required to submit such files).
Indicate by check mark whether the registrant is a large accelerated filer, an accelerated filer, a non-accelerated filer, a smaller reporting company, or an emerging growth company. See the definitions of "large accelerated filer," "accelerated filer," "smaller reporting company," and "emerging growth company" in Rule 12b-2 of the Exchange Act.
|
Large accelerated filer |
☐ |
|
Accelerated filer |
☐ |
|
Non-accelerated filer |
☒ |
|
Smaller reporting company |
|
|
Emerging growth company |
|
|
|
|
If an emerging growth company, indicate by check mark if the registrant has elected not to use the extended transition period for complying with any new or revised financial accounting standards provided pursuant to Section 13(a) of the Exchange Act. ☐
Indicate by check mark whether the registrant is a shell company (as defined in Rule 12b-2 of the Exchange Act).
Yes
As of October 27, 2020, there were outstanding
Graham Corporation and Subsidiaries
Index to Form 10-Q
As of September 30, 2020 and March 31, 2020 and for the Three and Six-Month Periods Ended September 30, 2020 and 2019
|
|
|
Page |
|
Part I. |
|
|
|
|
|
|
|
Item 1. |
||
|
|
|
|
|
Item 2. |
Management’s Discussion and Analysis of Financial Condition and Results of Operations |
16 |
|
|
|
|
|
Item 3. |
22 |
|
|
|
|
|
|
Item 4. |
23 |
|
|
|
|
|
|
Part II. |
|
|
|
|
|
|
|
Item 1A. |
24 |
|
|
|
|
|
|
Item 6. |
25 |
|
|
|
|
|
|
26 |
||
|
|
|
|
2
GRAHAM CORPORATION AND SUBSIDIARIES
FORM 10-Q
SEPTEMBER 30, 2020
PART I – FINANCIAL INFORMATION
3
|
Item 1. |
Unaudited Condensed Consolidated Financial Statements |
GRAHAM CORPORATION AND SUBSIDIARIES
CONDENSED CONSOLIDATED STATEMENTS OF INCOME
(Unaudited)
|
|
|
Three Months Ended |
|
|
Six Months Ended |
|
||||||||||
|
|
|
September 30, |
|
|
September 30, |
|
||||||||||
|
|
|
2020 |
|
|
2019 |
|
|
2020 |
|
|
2019 |
|
||||
|
|
|
(Amounts in thousands, except per share data) |
|
|
(Amounts in thousands, except per share data) |
|
||||||||||
|
Net sales |
|
$ |
|
|
|
$ |
|
|
|
$ |
|
|
|
$ |
|
|
|
Cost of products sold |
|
|
|
|
|
|
|
|
|
|
|
|
|
|
|
|
|
Gross profit |
|
|
|
|
|
|
|
|
|
|
|
|
|
|
|
|
|
Other expenses and income: |
|
|
|
|
|
|
|
|
|
|
|
|
|
|
|
|
|
Selling, general and administrative |
|
|
|
|
|
|
|
|
|
|
|
|
|
|
|
|
|
Selling, general and administrative – amortization |
|
|
— |
|
|
|
— |
|
|
|
— |
|
|
|
|
|
|
Other expense |
|
|
— |
|
|
|
— |
|
|
|
— |
|
|
|
|
|
|
Other income |
|
|
( |
) |
|
|
( |
) |
|
|
( |
) |
|
|
( |
) |
|
Interest income |
|
|
( |
) |
|
|
( |
) |
|
|
( |
) |
|
|
( |
) |
|
Interest expense |
|
|
|
|
|
|
|
|
|
|
|
|
|
|
|
|
|
Total other expenses and income |
|
|
|
|
|
|
|
|
|
|
|
|
|
|
|
|
|
Income before provision for income taxes |
|
|
|
|
|
|
|
|
|
|
|
|
|
|
|
|
|
Provision for income taxes |
|
|
|
|
|
|
|
|
|
|
|
|
|
|
|
|
|
Net income |
|
$ |
|
|
|
$ |
|
|
|
$ |
|
|
|
$ |
|
|
|
Per share data |
|
|
|
|
|
|
|
|
|
|
|
|
|
|
|
|
|
Basic: |
|
|
|
|
|
|
|
|
|
|
|
|
|
|
|
|
|
Net income |
|
$ |
|
|
|
$ |
|
|
|
$ |
|
|
|
$ |
|
|
|
Diluted: |
|
|
|
|
|
|
|
|
|
|
|
|
|
|
|
|
|
Net income |
|
$ |
|
|
|
$ |
|
|
|
$ |
|
|
|
$ |
|
|
|
Weighted average common shares outstanding: |
|
|
|
|
|
|
|
|
|
|
|
|
|
|
|
|
|
Basic |
|
|
|
|
|
|
|
|
|
|
|
|
|
|
|
|
|
Diluted |
|
|
|
|
|
|
|
|
|
|
|
|
|
|
|
|
|
Dividends declared per share |
|
$ |
|
|
|
$ |
|
|
|
$ |
|
|
|
$ |
|
|
See Notes to Condensed Consolidated Financial Statements.
4
GRAHAM CORPORATION AND SUBSIDIARIES
CONDENSED CONSOLIDATED STATEMENTS OF COMPREHENSIVE INCOME
(Unaudited)
|
|
|
Three Months Ended |
|
|
Six Months Ended |
|
||||||||||
|
|
|
September 30, |
|
|
September 30, |
|
||||||||||
|
|
|
2020 |
|
|
2019 |
|
|
2020 |
|
|
2019 |
|
||||
|
|
|
(Amounts in thousands) |
|
|
(Amounts in thousands) |
|
||||||||||
|
Net income |
|
$ |
|
|
|
$ |
|
|
|
$ |
|
|
|
$ |
|
|
|
Other comprehensive income: |
|
|
|
|
|
|
|
|
|
|
|
|
|
|
|
|
|
Foreign currency translation adjustment |
|
|
|
|
|
|
( |
) |
|
|
|
|
|
|
( |
) |
|
Defined benefit pension and other postretirement plans net of income tax expense of $ ended September 30, 2020 and 2019, respectively, and $ and 2019, respectively |
|
|
|
|
|
|
|
|
|
|
|
|
|
|
|
|
|
Total other comprehensive income |
|
|
|
|
|
|
|
|
|
|
|
|
|
|
|
|
|
Total comprehensive income |
|
$ |
|
|
|
$ |
|
|
|
$ |
|
|
|
$ |
|
|
See Notes to Condensed Consolidated Financial Statements.
5
GRAHAM CORPORATION AND SUBSIDIARIES
CONDENSED CONSOLIDATED BALANCE SHEETS
(Unaudited)
|
|
|
September 30, |
|
|
March 31, |
|
||
|
|
|
2020 |
|
|
2020 |
|
||
|
|
|
(Amounts in thousands, except per share data) |
|
|||||
|
Assets |
|
|
|
|
|
|
|
|
|
Current assets: |
|
|
|
|
|
|
|
|
|
Cash and cash equivalents |
|
$ |
|
|
|
$ |
|
|
|
Investments |
|
|
|
|
|
|
|
|
|
Trade accounts receivable, net of allowances ($ March 31, 2020, respectively) |
|
|
|
|
|
|
|
|
|
Unbilled revenue |
|
|
|
|
|
|
|
|
|
Inventories |
|
|
|
|
|
|
|
|
|
Prepaid expenses and other current assets |
|
|
|
|
|
|
|
|
|
Income taxes receivable |
|
|
|
|
|
|
|
|
|
Total current assets |
|
|
|
|
|
|
|
|
|
Property, plant and equipment, net |
|
|
|
|
|
|
|
|
|
Prepaid pension asset |
|
|
|
|
|
|
|
|
|
Operating lease assets |
|
|
|
|
|
|
|
|
|
Other assets |
|
|
|
|
|
|
|
|
|
Total assets |
|
$ |
|
|
|
$ |
|
|
|
Liabilities and stockholders’ equity |
|
|
|
|
|
|
|
|
|
Current liabilities: |
|
|
|
|
|
|
|
|
|
Current portion of finance lease obligations |
|
$ |
|
|
|
$ |
|
|
|
Accounts payable |
|
|
|
|
|
|
|
|
|
Accrued compensation |
|
|
|
|
|
|
|
|
|
Accrued expenses and other current liabilities |
|
|
|
|
|
|
|
|
|
Customer deposits |
|
|
|
|
|
|
|
|
|
Operating lease liabilities |
|
|
|
|
|
|
|
|
|
Total current liabilities |
|
|
|
|
|
|
|
|
|
Finance lease obligations |
|
|
|
|
|
|
|
|
|
Operating lease liabilities |
|
|
|
|
|
|
|
|
|
Deferred income tax liability |
|
|
|
|
|
|
|
|
|
Accrued pension liability |
|
|
|
|
|
|
|
|
|
Accrued postretirement benefits |
|
|
|
|
|
|
|
|
|
Total liabilities |
|
|
|
|
|
|
|
|
|
Commitments and contingencies (Note 10) |
|
|
|
|
|
|
|
|
|
Stockholders’ equity: |
|
|
|
|
|
|
|
|
|
Preferred stock, $ |
|
|
|
|
|
|
|
|
|
Common stock, $ outstanding at September 30 and March 31, 2020, respectively |
|
|
|
|
|
|
|
|
|
Capital in excess of par value |
|
|
|
|
|
|
|
|
|
Retained earnings |
|
|
|
|
|
|
|
|
|
Accumulated other comprehensive loss |
|
|
( |
) |
|
|
( |
) |
|
Treasury stock ( respectively) |
|
|
( |
) |
|
|
( |
) |
|
Total stockholders’ equity |
|
|
|
|
|
|
|
|
|
Total liabilities and stockholders’ equity |
|
$ |
|
|
|
$ |
|
|
See Notes to Condensed Consolidated Financial Statements.
6
GRAHAM CORPORATION AND SUBSIDIARIES
CONDENSED CONSOLIDATED STATEMENTS OF CASH FLOWS
(Unaudited)
|
|
|
Six Months Ended |
|
|||||
|
|
|
September 30, |
|
|||||
|
|
|
2020 |
|
|
2019 |
|
||
|
Operating activities: |
|
(Dollar amounts in thousands) |
|
|||||
|
Net income |
|
$ |
|
|
|
$ |
|
|
|
Adjustments to reconcile net income to net cash used by operating activities: |
|
|
|
|
|
|
|
|
|
Depreciation |
|
|
|
|
|
|
|
|
|
Amortization |
|
|
— |
|
|
|
|
|
|
Amortization of actuarial losses |
|
|
|
|
|
|
|
|
|
Equity-based compensation expense |
|
|
|
|
|
|
|
|
|
Gain on disposal or sale of property, plant and equipment |
|
|
|
|
|
|
— |
|
|
Loss on sale of Energy Steel & Supply Co. |
|
|
— |
|
|
|
|
|
|
Deferred income taxes |
|
|
|
|
|
|
|
|
|
(Increase) decrease in operating assets: |
|
|
|
|
|
|
|
|
|
Accounts receivable |
|
|
( |
) |
|
|
|
|
|
Unbilled revenue |
|
|
|
|
|
|
( |
) |
|
Inventories |
|
|
|
|
|
|
|
|
|
Prepaid expenses and other current and non-current assets |
|
|
( |
) |
|
|
|
|
|
Income taxes receivable |
|
|
|
|
|
|
|
|
|
Operating lease assets |
|
|
|
|
|
|
|
|
|
Prepaid pension asset |
|
|
( |
) |
|
|
( |
) |
|
Increase (decrease) in operating liabilities: |
|
|
|
|
|
|
|
|
|
Accounts payable |
|
|
( |
) |
|
|
( |
) |
|
Accrued compensation, accrued expenses and other current and non-current liabilities |
|
|
|
|
|
|
( |
) |
|
Customer deposits |
|
|
( |
) |
|
|
( |
) |
|
Operating lease liabilities |
|
|
( |
) |
|
|
( |
) |
|
Long-term portion of accrued compensation, accrued pension liability and accrued postretirement benefits |
|
|
|
|
|
|
|
|
|
Net cash used by operating activities |
|
|
( |
) |
|
|
( |
) |
|
Investing activities: |
|
|
|
|
|
|
|
|
|
Purchase of property, plant and equipment |
|
|
( |
) |
|
|
( |
) |
|
Proceeds from disposal of property, plant and equipment |
|
|
|
|
|
|
— |
|
|
Proceeds from the sale of Energy Steel & Supply Co. |
|
|
— |
|
|
|
|
|
|
Purchase of investments |
|
|
( |
) |
|
|
( |
) |
|
Redemption of investments at maturity |
|
|
|
|
|
|
|
|
|
Net cash provided by investing activities |
|
|
|
|
|
|
|
|
|
Financing activities: |
|
|
|
|
|
|
|
|
|
Principal repayments on finance lease obligations |
|
|
( |
) |
|
|
( |
) |
|
Principal repayments on long-term debt |
|
|
( |
) |
|
|
|
|
|
Proceeds from the issuance of long-term debt |
|
|
|
|
|
|
|
|
|
Dividends paid |
|
|
( |
) |
|
|
( |
) |
|
Purchase of treasury stock |
|
|
( |
) |
|
|
( |
) |
|
Net cash used by financing activities |
|
|
( |
) |
|
|
( |
) |
|
Effect of exchange rate changes on cash |
|
|
|
|
|
|
( |
) |
|
Net increase (decrease) in cash and cash equivalents, including cash classified within current assets held for sale |
|
|
|
|
|
|
( |
) |
|
Net decrease in cash classified within current assets held for sale |
|
|
— |
|
|
|
|
|
|
Net increase (decrease) in cash and cash equivalents |
|
|
|
|
|
|
( |
) |
|
Cash and cash equivalents at beginning of period |
|
|
|
|
|
|
|
|
|
Cash and cash equivalents at end of period |
|
$ |
|
|
|
$ |
|
|
See Notes to Condensed Consolidated Financial Statements.
7
GRAHAM CORPORATION AND SUBSIDIARIES
CONDENSED CONSOLIDATED STATEMENTS OF CHANGES IN STOCKHOLDERS’ EQUITY
SIX MONTHS ENDED SEPTEMBER 30, 2020 AND 2019
(Unaudited)
|
|
|
Common Stock |
|
|
Capital in |
|
|
|
|
|
|
Accumulated Other |
|
|
|
|
|
|
Total |
|
||||||||
|
|
|
|
|
|
|
Par |
|
|
Excess of |
|
|
Retained |
|
|
Comprehensive |
|
|
Treasury |
|
|
Stockholders' |
|
||||||
|
|
|
Shares |
|
|
Value |
|
|
Par Value |
|
|
Earnings |
|
|
Loss |
|
|
Stock |
|
|
Equity |
|
|||||||
|
Balance at April 1, 2020 |
|
|
|
|
|
$ |
|
|
|
$ |
|
|
|
$ |
|
|
|
$ |
( |
) |
|
$ |
( |
) |
|
$ |
|
|
|
Comprehensive income |
|
|
|
|
|
|
|
|
|
|
|
|
|
|
( |
) |
|
|
|
|
|
|
|
|
|
|
( |
) |
|
Issuance of shares |
|
|
|
|
|
|
|
|
|
|
( |
) |
|
|
|
|
|
|
|
|
|
|
|
|
|
|
— |
|
|
Forfeiture of shares |
|
|
( |
) |
|
|
( |
) |
|
|
|
|
|
|
|
|
|
|
|
|
|
|
|
|
|
|
— |
|
|
Dividends |
|
|
|
|
|
|
|
|
|
|
|
|
|
|
( |
) |
|
|
|
|
|
|
|
|
|
|
( |
) |
|
Recognition of equity-based compensation expense |
|
|
|
|
|
|
|
|
|
|
|
|
|
|
|
|
|
|
|
|
|
|
|
|
|
|
|
|
|
Purchase of treasury stock |
|
|
|
|
|
|
|
|
|
|
|
|
|
|
|
|
|
|
|
|
|
|
( |
) |
|
|
( |
) |
|
Balance at June 30, 2020 |
|
|
|
|
|
|
|
|
|
|
|
|
|
|
|
|
|
|
( |
) |
|
|
( |
) |
|
|
|
|
|
Comprehensive income |
|
|
|
|
|
|
|
|
|
|
|
|
|
|
|
|
|
|
|
|
|
|
|
|
|
|
|
|
|
Dividends |
|
|
|
|
|
|
|
|
|
|
|
|
|
|
( |
) |
|
|
|
|
|
|
|
|
|
|
( |
) |
|
Recognition of equity-based compensation expense |
|
|
|
|
|
|
|
|
|
|
|
|
|
|
|
|
|
|
|
|
|
|
|
|
|
|
|
|
|
Issuance of treasury stock |
|
|
|
|
|
|
|
|
|
|
|
|
|
|
|
|
|
|
|
|
|
|
|
|
|
|
|
|
|
Balance at September 30, 2020 |
|
|
|
|
|
$ |
|
|
|
$ |
|
|
|
$ |
|
|
|
$ |
( |
) |
|
$ |
( |
) |
|
$ |
|
|
|
|
|
|
|
|
|
|
|
|
|
|
|
|
|
|
|
|
|
|
|
|
|
|
|
|
|
|
|
|
|
|
|
Common Stock |
|
|
Capital in |
|
|
|
|
|
|
Accumulated Other |
|
|
|
|
|
|
Total |
|
||||||||
|
|
|
|
|
|
|
Par |
|
|
Excess of |
|
|
Retained |
|
|
Comprehensive |
|
|
Treasury |
|
|
Stockholders' |
|
||||||
|
|
|
Shares |
|
|
Value |
|
|
Par Value |
|
|
Earnings |
|
|
Loss |
|
|
Stock |
|
|
Equity |
|
|||||||
|
Balance at April 1, 2019 |
|
|
|
|
|
$ |
|
|
|
$ |
|
|
|
$ |
|
|
|
$ |
( |
) |
|
$ |
( |
) |
|
$ |
|
|
|
Cumulative effect of change in accounting principle |
|
|
|
|
|
|
|
|
|
|
|
|
|
|
( |
) |
|
|
|
|
|
|
|
|
|
|
( |
) |
|
Comprehensive income |
|
|
|
|
|
|
|
|
|
|
|
|
|
|
|
|
|
|
|
|
|
|
|
|
|
|
|
|
|
Issuance of shares |
|
|
|
|
|
|
|
|
|
|
( |
) |
|
|
|
|
|
|
|
|
|
|
|
|
|
|
— |
|
|
Forfeiture of shares |
|
|
( |
) |
|
|
( |
) |
|
|
|
|
|
|
|
|
|
|
|
|
|
|
|
|
|
|
— |
|
|
Dividends |
|
|
|
|
|
|
|
|
|
|
|
|
|
|
( |
) |
|
|
|
|
|
|
|
|
|
|
( |
) |
|
Recognition of equity-based compensation expense |
|
|
|
|
|
|
|
|
|
|
|
|
|
|
|
|
|
|
|
|
|
|
|
|
|
|
|
|
|
Purchase of treasury stock |
|
|
|
|
|
|
|
|
|
|
|
|
|
|
|
|
|
|
|
|
|
|
( |
) |
|
|
( |
) |
|
Balance at June 30, 2019 |
|
|
|
|
|
|
|
|
|
|
|
|
|
|
|
|
|
|
( |
) |
|
|
( |
) |
|
|
|
|
|
Comprehensive income |
|
|
|
|
|
|
|
|
|
|
|
|
|
|
|
|
|
|
|
|
|
|
|
|
|
|
|
|
|
Dividends |
|
|
|
|
|
|
|
|
|
|
|
|
|
|
( |
) |
|
|
|
|
|
|
|
|
|
|
( |
) |
|
Recognition of equity-based compensation expense |
|
|
|
|
|
|
|
|
|
|
|
|
|
|
|
|
|
|
|
|
|
|
|
|
|
|
|
|
|
Issuance of treasury stock |
|
|
|
|
|
|
|
|
|
|
|
|
|
|
|
|
|
|
|
|
|
|
|
|
|
|
|
|
|
Balance at September 30, 2019 |
|
|
|
|
|
$ |
|
|
|
$ |
|
|
|
$ |
|
|
|
$ |
( |
) |
|
$ |
( |
) |
|
$ |
|
|
See Notes to Condensed Consolidated Financial Statements.
8
GRAHAM CORPORATION AND SUBSIDIARIES
NOTES TO CONDENSED CONSOLIDATED FINANCIAL STATEMENTS
(Unaudited)
(Amounts in thousands, except per share data)
NOTE 1 – BASIS OF PRESENTATION:
Graham Corporation's (the "Company's") Condensed Consolidated Financial Statements include its wholly-owned foreign subsidiaries located in Suzhou, China and Ahmedabad, India. The Condensed Consolidated Financial Statements have been prepared in accordance with accounting principles generally accepted in the U.S. ("GAAP") for interim financial information and the instructions to Form 10-Q and Rule 8-03 of Regulation S-X, each as promulgated by the U.S. Securities and Exchange Commission. The Company's Condensed Consolidated Financial Statements do not include all information and notes required by GAAP for complete financial statements. The unaudited Condensed Consolidated Balance Sheet as of March 31, 2020 presented herein was derived from the Company’s audited Consolidated Balance Sheet as of March 31, 2020. For additional information, please refer to the consolidated financial statements and notes included in the Company's Annual Report on Form 10-K for the fiscal year ended March 31, 2020 ("fiscal 2020"). In the opinion of management, all adjustments, including normal recurring accruals considered necessary for a fair presentation, have been included in the Company's Condensed Consolidated Financial Statements.
The Company's results of operations and cash flows for the three and six months ended September 30, 2020 are not necessarily indicative of the results that may be expected for the current fiscal year, which ends March 31, 2021 ("fiscal 2021").
NOTE 2 – REVENUE RECOGNITION:
The Company recognizes revenue on contracts when or as it satisfies a performance obligation by transferring control of the product to the customer. For contracts in which revenue is recognized upon shipment, control is generally transferred when products are shipped, title is transferred, significant risks of ownership have transferred, the Company has rights to payment, and rewards of ownership pass to the customer. For contracts in which revenue is recognized over time, control is generally transferred as the Company creates an asset that does not have an alternative use to the Company and the Company has an enforceable right to payment for the performance completed to date.
The following table presents the Company’s revenue disaggregated by product line and geographic area:
|
|
|
Three Months Ended |
|
|
Six Months Ended |
|
||||||||||
|
|
|
September 30, |
|
|
September 30, |
|
||||||||||
|
Product Line |
|
2020 |
|
|
2019 |
|
|
2020 |
|
|
2019 |
|
||||
|
Heat transfer equipment |
|
$ |
|
|
|
$ |
|
|
|
$ |
|
|
|
$ |
|
|
|
Vacuum equipment |
|
|
|
|
|
|
|
|
|
|
|
|
|
|
|
|
|
All other |
|
|
|
|
|
|
|
|
|
|
|
|
|
|
|
|
|
Net sales |
|
$ |
|
|
|
$ |
|
|
|
$ |
|
|
|
$ |
|
|
|
|
|
|
|
|
|
|
|
|
|
|
|
|
|
|
|
|
|
|
|
|
|
|
|
|
|
|
|
|
|
|
|
|
|
|
|
Geographic Region |
|
|
|
|
|
|
|
|
|
|
|
|
|
|
|
|
|
Asia |
|
$ |
|
|
|
$ |
|
|
|
$ |
|
|
|
$ |
|
|
|
Canada |
|
|
|
|
|
|
|
|
|
|
|
|
|
|
|
|
|
Middle East |
|
|
|
|
|
|
|
|
|
|
|
|
|
|
|
|
|
South America |
|
|
|
|
|
|
|
|
|
|
|
|
|
|
|
|
|
U.S. |
|
|
|
|
|
|
|
|
|
|
|
|
|
|
|
|
|
All other |
|
|
|
|
|
|
|
|
|
|
|
|
|
|
|
|
|
Net sales |
|
$ |
|
|
|
$ |
|
|
|
$ |
|
|
|
$ |
|
|
A performance obligation represents a promise in a contract to provide a distinct good or service to a customer. The Company accounts for a contract when it has approval and commitment from both parties, the rights of the parties are identified, payment terms are identified, the contract has commercial substance and collectability of consideration is probable. Transaction price reflects the
9
amount of consideration to which the Company expects to be entitled in exchange for transferred products. A contract’s transaction price is allocated to each distinct performance obligation and revenue is recognized as the performance obligation is satisfied. In certain cases, the Company may separate a contract into more than one performance obligation, while in other cases, several products may be part of a fully integrated solution and are bundled into a single performance obligation. If a contract is separated into more than one performance obligation, the Company allocates the total transaction price to each performance obligation in an amount based on the estimated relative standalone selling prices of the promised goods underlying each performance obligation. The Company has made an accounting policy election to exclude from the measurement of the contract price all taxes assessed by government authorities that are collected by the Company from its customers. The Company does not adjust the contract price for the effects of a financing component if the Company expects, at contract inception, that the period between when a product is transferred to a customer and when the customer pays for the product will be one year or less. Shipping and handling fees billed to the customer are recorded in revenue and the related costs incurred for shipping and handling are included in cost of products sold.
Revenue on the majority of the Company’s contracts, as measured by number of contracts, is recognized upon shipment to the customer. Revenue on larger contracts, which are fewer in number but represent the majority of revenue, is recognized over time. Revenue from contracts that is recognized upon shipment accounted for approximately
The timing of revenue recognition, invoicing and cash collections affect trade accounts receivable, unbilled revenue (contract assets) and customer deposits (contract liabilities) on the Condensed Consolidated Balance Sheets. Unbilled revenue represents revenue on contracts that is recognized over time and exceeds the amount that has been billed to the customer. Unbilled revenue is separately presented in the Condensed Consolidated Balance Sheets. The Company may have an unconditional right to payment upon billing and prior to satisfying the performance obligations. The Company will then record a contract liability and an offsetting asset of equal amount until the deposit is collected and the performance obligations are satisfied. Customer deposits are separately presented in the Condensed Consolidated Balance Sheets. Customer deposits are not considered a significant financing component as they are generally received less than one year before the product is completed or used to procure specific material on a contract, as well as related overhead costs incurred during design and construction.
Net contract assets (liabilities) consisted of the following:
|
|
|
September 30, 2020 |
|
|
March 31, 2020 |
|
|
Change |
|
|||
|
|
|
|
|
|
|
|
|
|
|
|
|
|
|
Unbilled revenue (contract assets) |
|
$ |
|
|
|
$ |
|
|
|
$ |
( |
) |
|
Customer deposits (contract liabilities) |
|
|
( |
) |
|
|
( |
) |
|
|
|
|
|
Net contract liabilities |
|
$ |
( |
) |
|
$ |
( |
) |
|
$ |
|
|
Contract liabilities at September 30, 2020 and March 31, 2020 include $
10
of $
Receivables billed but not paid under retainage provisions in the Company’s customer contracts were $
Incremental costs to obtain a contract consist of sales employee and agent commissions. Commissions paid to employees and sales agents are capitalized when paid and amortized to selling, general and administrative expense when the related revenue is recognized. Capitalized costs, net of amortization, to obtain a contract were $
The Company’s remaining unsatisfied performance obligations represent a measure of the total dollar value of work to be performed on contracts awarded and in progress. The Company also refers to this measure as backlog. As of September 30, 2020, the Company had remaining unsatisfied performance obligations of $
NOTE 3 – INVESTMENTS:
Investments consist of certificates of deposits with financial institutions. All investments have original maturities of greater than
NOTE 4 – INVENTORIES:
Inventories are stated at the lower of cost or net realizable value, using the average cost method.
Major classifications of inventories are as follows:
|
|
|
September 30, |
|
|
March 31, |
|
||
|
|
|
2020 |
|
|
2020 |
|
||
|
Raw materials and supplies |
|
$ |
|
|
|
$ |
|
|
|
Work in process |
|
|
|
|
|
|
|
|
|
Finished products |
|
|
|
|
|
|
|
|
|
Total |
|
$ |
|
|
|
$ |
|
|
NOTE 5 – EQUITY-BASED COMPENSATION:
The 2020 Graham Corporation Equity Incentive Plan (the "2020 Plan") was approved by the Company’s stockholders at the Annual Meeting on August 11, 2020 and provides for the issuance of
11
options may be granted at prices not less than the fair market value at the date of grant and expire no later than
During the three months ended September 30, 2020 and 2019, the Company recognized equity-based compensation costs related to restricted stock awards of $
The Company has an Employee Stock Purchase Plan (the "ESPP"), which allows eligible employees to purchase shares of the Company's common stock at a discount of up to
NOTE 6 – INCOME PER SHARE:
Basic income per share is computed by dividing net income by the weighted average number of common shares outstanding for the period. Diluted income per share is calculated by dividing net income by the weighted average number of common shares outstanding and, when applicable, potential common shares outstanding during the period.
|
|
|
Three Months Ended |
|
|
Six Months Ended |
|
||||||||||
|
|
|
September 30, |
|
|
September 30, |
|
||||||||||
|
|
|
2020 |
|
|
2019 |
|
|
2020 |
|
|
2019 |
|
||||
|
Basic income per share |
|
|
|
|
|
|
|
|
|
|
|
|
|
|
|
|
|
Numerator: |
|
|
|
|
|
|
|
|
|
|
|
|
|
|
|
|
|
Net income |
|
$ |
|
|
|
$ |
|
|
|
$ |
|
|
|
$ |
|
|
|
Denominator: |
|
|
|
|
|
|
|
|
|
|
|
|
|
|
|
|
|
Weighted average common shares outstanding |
|
|
|
|
|
|
|
|
|
|
|
|
|
|
|
|
|
Basic income per share |
|
$ |
|
|
|
$ |
|
|
|
$ |
|
|
|
$ |
|
|
|
Diluted income per share |
|
|
|
|
|
|
|
|
|
|
|
|
|
|
|
|
|
Numerator: |
|
|
|
|
|
|
|
|
|
|
|
|
|
|
|
|
|
Net income |
|
$ |
|
|
|
$ |
|
|
|
$ |
|
|
|
$ |
|
|
|
Denominator: |
|
|
|
|
|
|
|
|
|
|
|
|
|
|
|
|
|
Weighted average common shares outstanding |
|
|
|
|
|
|
|
|
|
|
|
|
|
|
|
|
|
Stock options outstanding |
|
|
— |
|
|
|
|
|
|
|
— |
|
|
|
|
|
|
Weighted average common and potential common shares outstanding |
|
|
|
|
|
|
|
|
|
|
|
|
|
|
|
|
|
Diluted income per share |
|
$ |
|
|
|
$ |
|
|
|
$ |
|
|
|
$ |
|
|
Options to purchase a total of
12
NOTE 7 – PRODUCT WARRANTY LIABILITY:
The reconciliation of the changes in the product warranty liability is as follows:
|
|
|
Three Months Ended |
|
|
Six Months Ended |
|
||||||||||
|
|
|
September 30, |
|
|
September 30, |
|
||||||||||
|
|
|
2020 |
|
|
2019 |
|
|
2020 |
|
|
2019 |
|
||||
|
Balance at beginning of period |
|
$ |
|
|
|
$ |
|
|
|
$ |
|
|
|
$ |
|
|
|
(Income) expense for product warranties |
|
|
|
|
|
|
|
|
|
|
( |
) |
|
|
|
|
|
Product warranty claims paid |
|
|
( |
) |
|
|
( |
) |
|
|
( |
) |
|
|
( |
) |
|
Balance at end of period |
|
$ |
|
|
|
$ |
|
|
|
$ |
|
|
|
$ |
|
|
Income of $
The product warranty liability is included in the line item "Accrued expenses and other current liabilities" in the Condensed Consolidated Balance Sheets.
NOTE 8 – CASH FLOW STATEMENT:
Interest paid was $
In the six months ended September 30, 2020 and 2019, non-cash activities included the issuance of treasury stock valued at $
At September 30, 2020 and 2019, there were $
NOTE 9 – EMPLOYEE BENEFIT PLANS:
The components of pension cost are as follows:
|
|
|
Three Months Ended |
|
|
Six Months Ended |
|
||||||||||
|
|
|
September 30, |
|
|
September 30, |
|
||||||||||
|
|
|
2020 |
|
|
2019 |
|
|
2020 |
|
|
2019 |
|
||||
|
Service cost |
|
$ |
|
|
|
$ |
|
|
|
$ |
|
|
|
$ |
|
|
|
Interest cost |
|
|
|
|
|
|
|
|
|
|
|
|
|
|
|
|
|
Expected return on assets |
|
|
( |
) |
|
|
( |
) |
|
|
( |
) |
|
|
( |
) |
|
Amortization of actuarial loss |
|
|
|
|
|
|
|
|
|
|
|
|
|
|
|
|
|
Net pension cost |
|
$ |
|
|
|
$ |
|
|
|
$ |
|
|
|
$ |
|
|
The Company made
The components of the postretirement benefit cost are as follows:
|
|
|
Three Months Ended |
|
|
Six Months Ended |
|
||||||||||
|
|
|
September 30, |
|
|
September 30, |
|
||||||||||
|
|
|
2020 |
|
|
2019 |
|
|
2020 |
|
|
2019 |
|
||||
|
Interest cost |
|
$ |
|
|
|
$ |
|
|
|
$ |
|
|
|
$ |
|
|
|
Amortization of actuarial loss |
|
|
|
|
|
|
|
|
|
|
|
|
|
|
|
|
|
Net postretirement benefit cost |
|
$ |
|
|
|
$ |
|
|
|
$ |
|
|
|
$ |
|
|
The Company paid
13
The components of net periodic benefit cost other than service cost are included in the line item “Other income” in the Condensed Consolidated Statements of Income.
The Company self-funds the medical insurance coverage it provides to its U.S. based employees. The Company maintains a stop loss insurance policy in order to limit its exposure to claims. The liability of $
NOTE 10 – COMMITMENTS AND CONTINGENCIES:
The Company has been named as a defendant in lawsuits alleging personal injury from exposure to asbestos allegedly contained in, or accompanying, products made by the Company. The Company is a co-defendant with numerous other defendants in these lawsuits and intends to vigorously defend itself against these claims. The claims in the Company’s current lawsuits are similar to those made in previous asbestos-related suits that named the Company as a defendant, which either were dismissed when it was shown that the Company had not supplied products to the plaintiffs’ places of work or were settled for immaterial amounts. The Company cannot provide any assurances that any pending or future matters will be resolved in the same manner as previous lawsuits.
As of September 30, 2020, the Company was subject to the claims noted above, as well as other legal proceedings and potential claims that have arisen in the ordinary course of business.
Although the outcome of the lawsuits, legal proceedings or potential claims to which the Company is, or may become, a party to cannot be determined and an estimate of the reasonably possible loss or range of loss cannot be made for the majority of the claims, management does not believe that the outcomes, either individually or in the aggregate, will have a material adverse effect on the Company’s results of operations, financial position or cash flows.
NOTE 11 – INCOME TAXES:
The Company files federal and state income tax returns in several domestic and international jurisdictions. In most tax jurisdictions, returns are subject to examination by the relevant tax authorities for a number of years after the returns have been filed. The Company is subject to U.S. federal examination for the tax years
There was
NOTE 12 – CHANGES IN ACCUMULATED OTHER COMPREHENSIVE LOSS:
The changes in accumulated other comprehensive loss by component for the six months ended September 30, 2020 and 2019 are as follows:
|
|
|
Pension and Other Postretirement Benefit Items |
|
|
Foreign Currency Items |
|
|
Total |
|
|||
|
Balance at April 1, 2020 |
|
$ |
( |
) |
|
$ |
( |
) |
|
$ |
( |
) |
|
Other comprehensive income before reclassifications |
|
|
— |
|
|
|
|
|
|
|
|
|
|
Amounts reclassified from accumulated other comprehensive loss |
|
|
|
|
|
|
— |
|
|
|
|
|
|
Net current-period other comprehensive income |
|
|
|
|
|
|
|
|
|
|
|
|
|
Balance at September 30, 2020 |
|
$ |
( |
) |
|
$ |
|
|
|
$ |
( |
) |
14
|
|
|
Pension and Other Postretirement Benefit Items |
|
|
Foreign Currency Items |
|
|
Total |
|
|||
|
Balance at April 1, 2019 |
|
$ |
( |
) |
|
$ |
|
|
|
$ |
( |
) |
|
Other comprehensive loss before reclassifications |
|
|
— |
|
|
|
( |
) |
|
|
( |
) |
|
Amounts reclassified from accumulated other comprehensive loss |
|
|
|
|
|
|
— |
|
|
|
|
|
|
Net current-period other comprehensive income (loss) |
|
|
|
|
|
|
( |
) |
|
|
|
|
|
Balance at September 30, 2019 |
|
$ |
( |
) |
|
$ |
( |
) |
|
$ |
( |
) |
The reclassifications out of accumulated other comprehensive loss by component for the three and six months ended September 30, 2020 and 2019 are as follows:
|
Details about Accumulated Other Comprehensive Loss Components |
|
Amount Reclassified from Accumulated Other Comprehensive Loss |
|
|
|
Affected Line Item in the Condensed Consolidated Statements of Income |
||||||
|
|
|
Three Months Ended |
|
|
|
|
||||||
|
|
|
September 30, |
|
|
|
|
||||||
|
|
|
2020 |
|
|
|
2019 |
|
|
|
|
||
|
Pension and other postretirement benefit items: |
|
|
|
|
|
|
|
|
|
|
|
|
|
Amortization of actuarial loss |
|
$ |
( |
) |
(1) |
|
$ |
( |
) |
(1) |
|
Income before provision for income taxes |
|
|
|
|
( |
) |
|
|
|
( |
) |
|
|
Provision for income taxes |
|
|
|
$ |
( |
) |
|
|
$ |
( |
) |
|
|
Net income |
|
Details about Accumulated Other Comprehensive Loss Components |
|
Amount Reclassified from Accumulated Other Comprehensive Loss |
|
|
|
Affected Line Item in the Condensed Consolidated Statements of Income |
||||||
|
|
|
Six Months Ended |
|
|
|
|
||||||
|
|
|
September 30, |
|
|
|
|
||||||
|
|
|
2020 |
|
|
|
2019 |
|
|
|
|
||
|
Pension and other postretirement benefit items: |
|
|
|
|
|
|
|
|
|
|
|
|
|
Amortization of actuarial loss |
|
$ |
( |
) |
(1) |
|
$ |
( |
) |
(1) |
|
Income before provision for income taxes |
|
|
|
|
( |
) |
|
|
|
( |
) |
|
|
Provision for income taxes |
|
|
|
$ |
( |
) |
|
|
$ |
( |
) |
|
|
Net income |
|
(1) |
These accumulated other comprehensive loss components are included within the computation of pension and other postretirement benefit costs. See Note 9. |
NOTE 13 – OTHER EXPENSE:
On June 24, 2019, the Company completed the sale of its subsidiary, Energy Steel & Supply Co., to Hayward Tyler, a division of Avingtrans PLC, a global leader in performance-critical pumps and motors for the energy sector. Under the terms of the stock purchase agreement, the Company received proceeds of $
NOTE 14 – ACCOUNTING AND REPORTING CHANGES:
In the normal course of business, management evaluates all new accounting pronouncements issued by the Financial Accounting Standards Board ("FASB"), the Securities and Exchange Commission, the Emerging Issues Task Force, the American Institute of Certified Public Accountants or any other authoritative accounting body to determine the potential impact they may have on the Company's consolidated financial statements.
Management does not expect any recently issued accounting pronouncements, which have not already been adopted, to have a material impact on the Company's consolidated financial statements.
15
Item 2.Management’s Discussion and Analysis of Financial Condition and Results of Operations
(Dollar amounts in thousands, except per share data)
Overview
We are a global business that designs, manufactures and sells critical equipment for the energy, defense and chemical/petrochemical industries. Our energy markets include oil refining, cogeneration, and alternative power. For the defense industry, our equipment is used in nuclear propulsion power systems for the U.S. Navy. For the chemical and petrochemical industries, our equipment is used in fertilizer, ethylene, methanol and downstream chemical facilities.
Our global brand is built upon our world-renowned engineering expertise in vacuum and heat transfer technology, responsive and flexible service and high quality standards. We design and manufacture custom-engineered ejectors, vacuum pumping systems, surface condensers and vacuum systems. Our equipment can also be found in other diverse applications such as metal refining, pulp and paper processing, water heating, refrigeration, desalination, food processing, pharmaceutical, and heating, ventilating and air conditioning.
Our corporate headquarters are located in Batavia, New York. We have production facilities co-located with our headquarters in Batavia. We also have wholly-owned foreign subsidiaries, Graham Vacuum and Heat Transfer Technology (Suzhou) Co., Ltd. ("GVHTT"), located in Suzhou, China and Graham India Private Limited ("GIPL"), located in Ahmedabad, India. GVHTT provides sales and engineering support for us in the People's Republic of China and management oversight throughout Southeast Asia. GIPL serves as a sales and market development office focusing on the refining, petrochemical and fertilizer markets in India.
In the first quarter of the fiscal year ended March 31, 2020 (which we refer to as "fiscal 2020"), we completed the sale of our commercial nuclear utility business, Energy Steel and Supply Co. ("Energy Steel").
Our current fiscal year (which we refer to as "fiscal 2021") ends March 31, 2021.
Highlights
Highlights for the three and six months ended September 30, 2020 include:
|
|
• |
Net sales for the second quarter of fiscal 2021 were $27,954 up 29% compared with $21,643 for the second quarter of fiscal 2020. Net sales for the first six months of fiscal 2021 were $44,664, up 6% compared with net sales of $42,236 for the first six months of fiscal 2020. Included in the first six months of fiscal 2020 were sales of $1,276 for our commercial nuclear utility business, which was sold in the first quarter of fiscal 2020. |
|
|
• |
Net income and income per diluted share for the second quarter of fiscal 2021 were $2,744 and $0.27, respectively, compared with $1,205 and $0.12, respectively, in the second quarter of fiscal 2020. Net income and income per diluted share for the first six months of fiscal 2021 were $926 and $0.09, respectively, compared with net income of $1,287 and income per diluted share of $0.13 for the first six months of fiscal 2020. Included in net income and income per diluted share for the first six months of fiscal 2020 was a loss of $893 and $0.09, respectively, for our commercial nuclear utility business, which was sold in the first quarter of fiscal 2020. |
|
|
• |
Results in the first half of fiscal 2021 were impacted by the COVID-19 pandemic. During the first quarter, we purposely reduced production at our facility in Batavia, New York to proactively address the risk to our employees from the COVID-19 pandemic. We began the first quarter at 10% of normal staffing capacity and gradually increased production, reaching to normal capacity by early June 2020. On average, we were at approximately 50% of normal staffing capacity across the first quarter. This reduction in staffing significantly affected our sales and earnings in such quarter, which negatively impacted the first six months of fiscal 2021. Our staffing in the second quarter was back to normal levels. |
|
|
• |
Orders booked in the second quarter of fiscal 2021 were $34,974, compared with the second quarter of fiscal 2020 when orders booked were $32,552. Orders booked in the first six months of fiscal 2021 were $46,442, compared with the first six months of fiscal 2020 when orders booked were $47,641. |
|
|
• |
Backlog was $114,851 at September 30, 2020, compared with $107,220 at June 30, 2020 and $112,389 at March 31, 2020. |
16
|
|
• |
Gross profit margin and operating margin for the second quarter of fiscal 2021 were 28% and 12%, respectively, compared with 23% and 5%, respectively, for the second quarter of fiscal 2020. Gross profit margin and operating margin for the first six months of fiscal 2021 were 21% and 2%, respectively, compared with 23% and 2%, respectively, for the first six months of fiscal 2020. |
|
|
• |
Cash and short-term investments at September 30, 2020 were $67,856, compared with $73,003 at March 31, 2020. |
Forward-Looking Statements
This report and other documents we file with the Securities and Exchange Commission include "forward-looking statements" within the meaning of Section 27A of the Securities Act of 1933, as amended, and Section 21E of the Securities Exchange Act of 1934, as amended.
These statements involve known and unknown risks, uncertainties and other factors that may cause actual results to be materially different from any future results implied by the forward-looking statements. Such factors include, but are not limited to, the risks and uncertainties identified by us under the heading "Risk Factors" in Item 1A of our Annual Report on Form 10-K for fiscal 2020.
Forward-looking statements may also include, but are not limited to, statements about:
|
|
• |
the impacts of, and risks caused by, the COVID-19 pandemic on our business operations, our customers and our markets; |
|
|
• |
the current and future economic environments, including the downturn associated with the COVID-19 pandemic, affecting us and the markets we serve; |
|
|
• |
expectations regarding investments in new projects by our customers; |
|
|
• |
sources of revenue and anticipated revenue, including the contribution from anticipated growth; |
|
|
• |
expectations regarding achievement of revenue and profitability; |
|
|
• |
plans for future products and services and for enhancements to existing products and services; |
|
|
• |
our operations in foreign countries; |
|
|
• |
political instability in regions in which our customers are located; |
|
|
• |
tariffs and trade relations between the United States and its trading partners; |
|
|
• |
our ability to execute our growth and acquisition strategy; |
|
|
• |
our ability to maintain or expand work for the U.S. Navy; |
|
|
• |
our ability to successfully execute our existing contracts; |
|
|
• |
estimates regarding our liquidity and capital requirements; |
|
|
• |
timing of conversion of backlog to sales; |
|
|
• |
our ability to attract or retain customers; |
|
|
• |
the outcome of any existing or future litigation; and |
|
|
• |
our ability to increase our productivity and capacity. |
Forward-looking statements are usually accompanied by words such as "anticipate," "believe," "contemplate," "continue," "could," "estimate," "may," "might," "intend," "interest," "appear," "expect," "suggest," "plan," "predict," "project," "encourage," "potential," "should," "view," "will," and similar expressions. Actual results could differ materially from historical results or those implied by the forward-looking statements contained in this report.
Undue reliance should not be placed on our forward-looking statements. Except as required by law, we undertake no obligation to update or announce any revisions to forward-looking statements contained in this report, whether as a result of new information, future events or otherwise.
Current Market Conditions
We continue to operate within disrupted energy and petrochemical markets (which we refer to as our “commercial markets”). A slowdown in our commercial markets began during the latter part of fiscal 2020. This slowdown was primarily caused
17
by an excess supply of crude oil, which had a negative impact on commodity pricing. The economic slowdown and corresponding reductions in demand for transportation fuel and petrochemical products caused by the ongoing COVID-19 global pandemic further adversely affected our commercial markets. As a result of this combination of adverse supply-side and demand-side disruptions, our commercial customers have significantly reduced their operating budgets for products and services like those that we offer. The timing and catalyst for a recovery in our commercial markets remains uncertain and we believe that in the near term the quantity of projects available for us to compete for will be fewer and that the pricing environment will continue to be challenging.
Over the long-term, however, we expect that population growth, an expanding global middle class and an increasing desire for more industrial products will drive increased demand for chemical and petrochemical products. Moreover, once global economies return to stable growth, we expect investment in new global chemical and petrochemical capacity will resume and that such investments will drive growth in demand for our products and services.
Energy markets, in particular crude oil refining, are undergoing a more fundamental evolution. We believe that systemic changes in the energy markets are being driven, in part, by the increasing use by consumers of alternative fuels in lieu of fossil fuel. As a result, we anticipate demand growth for fossil-based fuels will be less than the global GDP growth rate and that crude oil refiners will focus new investments toward the installed base, and that inefficient refineries will close and new refining capacity will be co-located where fuels and petrochemicals are produced. We also anticipate that future investment by refiners in renewable fuels (e.g., renewable diesel), in existing refineries (e.g., to expand feedstock processing flexibility, improve conversion of oil to refined products) to gain greater throughput, or to build new capacity (e.g., integrated refineries with petrochemical products capabilities) will continue to drive demand for our products and services.
Demand for our products in the defense industry is related to the naval nuclear propulsion market which is tied to aircraft carrier and submarine vessel construction schedules of the primary shipyards contracted by the U.S. Navy. We expect growth in our naval nuclear propulsion business will result from our strategic actions to increase our market share, our successful performance, and expected demand increases. The economic slowdown caused by the COVID-19 pandemic has not adversely effected demand for our products or services in the naval market.
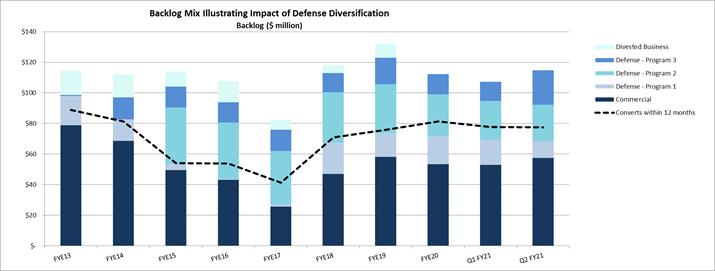
The chart below shows the impact of our successful diversification strategy into multiple U.S. Navy defense platforms. Our U.S. Navy defense business, which began with our entry into the nuclear carrier program and expanded into both the Virginia and Columbia class nuclear submarine programs, made up 50% of our total backlog at September 30, 2020. Each vessel platform has made up at least 10% of our total backlog for the past three years. We believe this diversification is especially beneficial when our commercial markets are weak, as is presently the case.
*Note: FYE refers to fiscal year ended March 31
Results of Operations
To better understand the significant factors that influenced our performance during the periods presented, the following discussion should be read in conjunction with our Condensed Consolidated Financial Statements and the notes to our Condensed Consolidated Financial Statements included in Part I, Item 1, of this Quarterly Report on Form 10-Q.
18
The following table summarizes our results of operations for the periods indicated:
|
|
|
Three Months Ended |
|
|
Six Months Ended |
|
||||||||||
|
|
|
September 30, |
|
|
September 30, |
|
||||||||||
|
|
|
2020 |
|
|
2019 |
|
|
2020 |
|
|
2019 |
|
||||
|
Net sales |
|
$ |
27,954 |
|
|
$ |
21,643 |
|
|
$ |
44,664 |
|
|
$ |
42,236 |
|
|
Gross profit |
|
$ |
7,693 |
|
|
$ |
4,948 |
|
|
$ |
9,261 |
|
|
$ |
9,662 |
|
|
Gross profit margin |
|
|
28 |
% |
|
|
23 |
% |
|
|
21 |
% |
|
|
23 |
% |
|
SG&A expense (1) |
|
$ |
4,253 |
|
|
$ |
3,847 |
|
|
$ |
8,155 |
|
|
$ |
8,414 |
|
|
SG&A as a percent of sales |
|
|
15 |
% |
|
|
18 |
% |
|
|
18 |
% |
|
|
20 |
% |
|
Net income |
|
$ |
2,744 |
|
|
$ |
1,205 |
|
|
$ |
926 |
|
|
$ |
1,287 |
|
|
Diluted income per share |
|
$ |
0.27 |
|
|
$ |
0.12 |
|
|
$ |
0.09 |
|
|
$ |
0.13 |
|
|
Total assets |
|
$ |
144,622 |
|
|
$ |
146,464 |
|
|
$ |
144,622 |
|
|
$ |
146,464 |
|
|
Total assets excluding cash, cash equivalents and investments |
|
$ |
76,766 |
|
|
$ |
72,668 |
|
|
$ |
76,766 |
|
|
$ |
72,668 |
|
|
|
(1) |
Selling, general and administrative expense is referred to as "SG&A". |
The Second Quarter and First Six Months of Fiscal 2021 Compared With the Second Quarter and First Six Months of Fiscal 2020
Sales for the second quarter of fiscal 2021 were $27,954, a 29% increase compared with $21,643 for the second quarter of fiscal 2020. Our domestic sales, as a percentage of aggregate product sales, were 62% in the second quarter of fiscal 2021 compared with 73% in the second quarter of fiscal 2020. Domestic sales year-over-year increased $1,521, or 10%. International sales increased $4,790, or 81%, in the second quarter of fiscal 2021 compared with the second quarter of fiscal 2020. Sales in the three months ended September 30, 2020 were 37% to the refining industry, 19% to the chemical and petrochemical industries, 34% for the defense (U.S. Navy) industry, and 10% to other commercial and industrial applications. Sales in the three months ended September 30, 2019 were 29% to the refining industry, 48% to the chemical and petrochemical industries, 12% for the defense (U.S. Navy) industry, and 11% to other commercial and industrial applications. Fluctuation in sales among markets, products and geographic locations varies, sometimes significantly, from quarter-to-quarter based on timing, quantity, and value of projects. See also "Current Market Conditions," above. For additional information on anticipated future sales and our markets, see "Orders and Backlog" below.
Sales for the first six months of fiscal 2021 were $44,664, an increase of $2,428, or 6% compared with $42,236 for the first six months of fiscal 2020. Our domestic sales, as a percentage of aggregate product sales, were 60% in the first six months of fiscal 2021 compared with 71% in the same period in fiscal 2020. Domestic sales decreased $3,489, or 12%, while international sales increased by $5,917, or 49%, each as compared with the same prior year period. International sales accounted for 40% and 29% of total sales for the first six months of fiscal 2021 and fiscal 2020, respectively. Sales in the six months ended September 30, 2020 were 29% to the refining industry, 30% to the chemical and petrochemical industries, 29% for the defense industry (U.S. Navy), and 12% to other commercial and industrial applications. Sales in the six months ended September 30, 2019 were 33% to the refining industry, 42% to the chemical and petrochemical industries, 11% for the defense (U.S. Navy) industry, and 14% to other commercial and industrial applications.
Gross profit margin for the second quarter of fiscal 2021 was 28% compared with 23% for the second quarter of fiscal 2020. Gross profit for the second quarter of fiscal 2021 increased 55% compared with fiscal 2020, to $7,693 from $4,948. The increase in gross profit was driven by higher volume, which was due to increased throughput at our Batavia facility, as well as, accelerated conversion at our global fabrication partner’s facilities and the completion of a materials only order.
Gross profit margin for the first six months of fiscal 2021 was 21% compared with 23% for the first six months of fiscal 2020. Gross profit for the first six months of fiscal 2021 decreased 4% compared with the first six months of fiscal 2020, to $9,261 from $9,662. Gross profit margin in the first six months of fiscal 2021 was adversely impacted by the underutilization of our Batavia facility in the first quarter as a result of the COVID-19 pandemic.
SG&A expenses as a percent of sales for the three and six-month periods ended September 30, 2020 were 15% and 18%, respectively. SG&A expenses in the second quarter of fiscal 2021 were $4,253, an increase of $406 compared with SG&A expenses of $3,847 in the second quarter of fiscal 2020. SG&A expenses in the first six months of fiscal 2021 were $8,155, a decrease of $259 compared with SG&A expenses of $8,414 in the first six months of fiscal 2020. Included in the first six months of fiscal 2020, was $621 for the divested commercial nuclear utility business.
19
Interest income for the three and six-month periods ended September 30, 2020 was $26 and $120, respectively, compared with $363 and $762, respectively, for the same periods ended September 30, 2019. The decrease in interest income is due to market investment rates, which are significantly lower when compared with rates a year ago. Interest expense for the three and six-month periods ended September 30, 2020 was $3 and $8, respectively, compared with $4 and $7, respectively, for the same periods ended September 30, 2019.
Our effective tax rate for each of the three and six-month periods ended September 30, 2020 was 22% and 30%, respectively. The effective tax rate for each of the three and six-month periods ended September 30, 2019 was 22%. The higher six-month tax rate in fiscal 2021 was due to the loss we incurred in the first quarter of fiscal 2021. Our effective tax rate for the full fiscal year is expected to be closer to 22%.
Net income and income per diluted share for the second quarter of fiscal 2021 were $2,744 and $0.27, respectively, compared with $1,205 and $0.12, respectively, in the second quarter of fiscal 2020. Net income and income per diluted share for the first six months of fiscal 2021 were $926 and $0.09, respectively, compared with net income of $1,287 and income per diluted share of $0.13 for the first six months of fiscal 2020. Included in net income and income per diluted share for the first six months of fiscal 2020 was a loss of $893 and $0.09, respectively, for our commercial nuclear utility business, which was sold in the first quarter of fiscal 2020.
Liquidity and Capital Resources
The following discussion should be read in conjunction with our Condensed Consolidated Balance Sheets and Statements of Cash Flows:
|
|
|
September 30, |
|
|
March 31, |
|
||
|
|
|
2020 |
|
|
2020 |
|
||
|
Cash and investments |
|
$ |
67,856 |
|
|
$ |
73,003 |
|
|
Working capital |
|
|
77,546 |
|
|
|
77,443 |
|
|
Working capital ratio(1) |
|
|
2.7 |
|
|
|
2.6 |
|
|
Working capital excluding cash and investments |
|
|
9,690 |
|
|
|
4,440 |
|
|
Working capital excluding cash and investments as a percent of net sales(2) |
|
|
10.4 |
% |
|
|
4.9 |
% |
|
|
(1) |
Working capital ratio equals current assets divided by current liabilities. |
|
|
(2) |
Working capital excluding cash and investments as a percent of net sales is based upon trailing twelve month sales. |
Net cash used by operating activities for the first six months of fiscal 2021 was $2,258, compared with cash usage of $1,915 for the first six months of fiscal 2020. The cash usage comparison year over year was attributable primarily to an increase in accounts receivable, mostly offset by a decrease in unbilled revenue due to timing. The increase in working capital excluding cash and investments as a percent of net sales was due to timing of working capital.
Dividend payments and capital expenditures in the first six months of fiscal 2021 were $2,195 and $797, respectively, compared with $2,075 and $679, respectively, for the first six months of fiscal 2020.
Capital expenditures for fiscal 2021 are expected to be between approximately $2,000 and $2,500.
Cash and investments were $67,856 on September 30, 2020 compared with $73,003 on March 31, 2020, down $5,146.
We invest net cash generated from operations in excess of cash held for near-term needs in short-term, less than 365 days, certificates of deposit, money market accounts or U.S. government instruments, generally with maturity periods of up to 180 days. Our money market account is used to securitize our outstanding letters of credit, which reduces our cost on those letters of credit. Approximately 95% of our cash and investments are held in the U.S. The remaining 5% is invested in our China operations.
Our revolving credit facility with JP Morgan Chase, N.A. ("JP Morgan Chase") provides us with a line of credit of $25,000, including letters of credit and bank guarantees. In addition, our JP Morgan Chase agreement allows us to increase the line of credit, at our discretion, up to another $25,000, for total availability of $50,000. Borrowings under this credit facility are secured by all of our assets. We have a $14,000 line of credit with HSBC, N.A. ("HSBC") secured by certain of our deposit accounts with HSBC. Letters of credit outstanding on September 30, 2020 and March 31, 2020 were $17,161 and $13,328, respectively. The outstanding letters of credit as of September 30, 2020 were issued by JP Morgan Chase and HSBC. There were no other amounts outstanding on our credit facilities at September 30, 2020 and March 31, 2020. The borrowing rate under our JP Morgan Chase facility as of September 30,
20
2020 was the bank’s prime rate, or 3.25%. Availability under the JP Morgan Chase and HSBC lines of credit was $21,839 and $21,672, respectively, at September 30, 2020 and March 31, 2020, respectively. We believe that cash generated from operations, combined with our investments and available financing capacity under our credit facility, will be adequate both to meet our cash needs for the immediate future and to support our growth strategies.
Orders and Backlog
Orders for the three-month period ended September 30, 2020 were $34,974, net of a change order reduction of $1,264, compared with $32,552 for the same period last year. Orders represent written communications received from customers requesting us to supply products and/or services. Domestic orders were 46% of total orders, or $16,117, and international orders were 54% of total orders, or $18,857, in the second quarter of fiscal 2021 compared with the second quarter of fiscal 2020 when domestic orders were 33%, or $10,759, of total orders, and international orders were 67%, or $21,793, of total orders.
During the first six months of fiscal 2021, orders were $46,442, compared with $47,641 for the same period of fiscal 2020. Domestic orders were 42% of total orders, or $19,349, and international orders were 58% of total orders, or $27,093, in the first six months of fiscal 2021 compared with the same period of fiscal 2020 when domestic orders were 46%, or $21,916, of total orders, and international orders were 54%, or $25,725, of total orders.
Backlog was $114,851 at September 30, 2020, compared with $107,220 on June 30, 2020, and $112,389 at March 31, 2020. Backlog is defined as the total dollar value of orders received for which revenue has not yet been recognized. Approximately 60% to 65% of orders currently in our backlog are expected to be converted to sales within one year. The majority of the backlog that is expected to convert beyond twelve months is for the defense industry, specifically the U.S. Navy. At September 30, 2020, 37% of our backlog was attributable to equipment for refinery project work, 9% for chemical and petrochemical projects, 50% for defense (U.S. Navy) projects and 4% for other commercial and industrial applications. At September 30, 2019, 32% of our backlog was attributable to equipment for refinery project work, 16% for chemical and petrochemical projects, 48% for U.S. Navy projects and 4% for power and other industrial applications. We had two projects totaling $3,165 cancelled in fiscal 2020 and a third project of $654 cancelled in the first six months of fiscal 2021. At September 30, 2020, we had two projects totaling $562 on hold.
Outlook
Capital spending in the energy markets we serve began to decrease during the second half of fiscal 2020 and the pace of activity materially contracted as COVID-19 became a global pandemic in the fourth quarter of fiscal 2020. The weak energy markets have continued into fiscal 2021 and are particularly evident in our North American markets. As a result, our overall bidding activity has slowed. There has also been a shift toward more opportunities in emerging markets. At September 30, 2020, 50% of our backlog was for the defense industry, specifically the U.S. Navy. Our pipeline for the U.S. Navy continues to be robust, but quarterly fluctuations in order levels will occur due to the size and timing of release of the U.S. Navy projects. Defense programs in backlog are planned to deliver $20 to $30 million per year of revenue in fiscal 2021 and beyond.
Near term opportunities in the global energy and petrochemical markets have slowed significantly due to the combined impact of the COVID-19 pandemic and the geopolitical imbalance of supply. Although we do not know when the COVID-19 pandemic will end or when the supply imbalance will subside, we continue to believe that the energy and petrochemical markets provide long-term growth opportunities for our products and services. Coupled with our diversification strategy into the defense industry, we remain confident in our ability to achieve the long-term goal of significantly growing our business. We have invested in capacity to serve our commercial customers as well as to expand the work we do for the U.S. Navy. We intend to continue to look for organic growth opportunities as well as acquisitions or other business combinations that we believe will allow us to expand our presence in both our existing and ancillary markets.
Our expectations for sales and profitability in fiscal 2021 assume that we are able to operate our production facility in Batavia, New York at or near normal capacity for the last two quarters of fiscal 2021 without any additional COVID-19 related reductions in production capacity. In our first quarter of fiscal 2021, our production capability was significantly reduced due to the COVID-19 pandemic. Our production was at approximately 50% of normal production across the first quarter of fiscal 2021. Our production capacity returned to a normal level in the second quarter of fiscal 2021. Our outlook is based upon the assumption that we are able to operate our production facility, have access to the global supply chain, including our subcontractors, with minimal or no disruptions, whether as a result of the COVID-19 pandemic or any other circumstances.
We project that approximately 60% to 65% of our $114,851 backlog at September 30, 2020 will convert to sales over the next twelve months. We expect the remaining backlog will convert beyond twelve months, which includes a combination of U.S. Navy orders that have a long conversion cycle (up to five years) as well as certain commercial orders, the conversion of which has been extended by our customers. We had two projects totaling $3,165 cancelled in fiscal 2020 and a third project of $654 cancelled in
21
the first six months of fiscal 2021. At September 30, 2020, we had two projects totaling $562 on hold by our customers. In addition, we have three projects which have been delayed by our customers due to COVID-19 and related energy market dynamics, and we therefore expect revenue of $4,118 to be delayed beyond fiscal 2021. None of these amounts changed during the second quarter of fiscal 2021.
We expect fiscal year 2021 revenue to be between $90,000 and $95,000, gross profit margin to be in the 22% to 24% range and SG&A expenses to be between $17,000 and $17,500. We expect interest income to be de minimis, given the low market rates on short term cash and investments. Our effective tax rate during fiscal 2021 is expected to be approximately 22%. This outlook incorporates the very challenged first quarter which we experienced as a result of the COVID-19 pandemic, and assumes that we are able to continue to operate near normal capacity for the last six months of fiscal 2021.
Cash flow was negative in the first six months of fiscal 2021, however, we expect positive cash flow from operations for the remainder of fiscal 2021.
Contingencies and Commitments
We have been named as a defendant in lawsuits alleging personal injury from exposure to asbestos allegedly contained in or accompanying our products. We are a co-defendant with numerous other defendants in these lawsuits and intend to vigorously defend ourselves against these claims. The claims in our current lawsuits are similar to those made in previous asbestos lawsuits that named us as a defendant. Such previous lawsuits either were dismissed when it was shown that we had not supplied products to the plaintiffs’ places of work or were settled by us for immaterial amounts.
As of September 30, 2020, we are subject to the claims noted above, as well as other legal proceedings and potential claims that have arisen in the ordinary course of business. Although the outcome of the lawsuits, legal proceedings or potential claims to which we are or may become a party cannot be determined and an estimate of the reasonably possible loss or range of loss cannot be made for the majority of the claims, we do not believe that the outcomes, either individually or in the aggregate, will have a material effect on our results of operations, financial position or cash flows.
Critical Accounting Policies, Estimates, and Judgments
Our unaudited condensed consolidated financial statements are based on the selection of accounting policies and the application of significant accounting estimates, some of which require management to make significant assumptions. We believe that the most critical accounting estimates used in the preparation of our condensed consolidated financial statements relate to labor hour estimates and establishment of operational milestones which are used to recognize revenue under the overtime recognition model, accounting for contingencies, under which we accrue a loss when it is probable that a liability has been incurred and the amount can be reasonably estimated, and accounting for pensions and other postretirement benefits. For further information, refer to Item 7 "Management's Discussion and Analysis of Financial Condition and Results of Operations" and Item 8 "Financial Statements and Supplementary Data" included in our Annual Report on Form 10-K for the year ended March 31, 2020.
Off Balance Sheet Arrangements
We did not have any off balance sheet arrangements as of September 30, 2020 or March 31, 2020, other than letters of credit.
Item 3. Quantitative and Qualitative Disclosures About Market Risk
The principal market risks (i.e., the risk of loss arising from market changes) to which we are exposed are foreign currency exchange rates, price risk, project cancellation risk and trade policy.
The assumptions applied in preparing the following qualitative and quantitative disclosures regarding foreign currency exchange rate, price risk and project cancellation risk are based upon volatility ranges experienced by us in relevant historical periods, our current knowledge of the marketplace, and our judgment of the probability of future volatility based upon the historical trends and economic conditions of the markets in which we operate.
Foreign Currency
International consolidated sales for the three and six months ended September 30, 2020 were 38% and 40%, respectively, of total sales compared with 27% and 29%, respectively, for the same periods of fiscal 2020. Operating in markets throughout the world exposes us to movements in currency exchange rates. Currency movements can affect sales in several ways, the foremost being our
22
ability to compete for orders against foreign competitors that base their prices on relatively weaker currencies. Business lost due to competition for orders against competitors using a relatively weaker currency cannot be quantified. In addition, cash can be adversely impacted by the conversion of sales made by us in a foreign currency to U.S. dollars. In the first three and six months of fiscal 2021 and fiscal 2020, all sales by us and our wholly-owned subsidiaries, for which we were paid, were denominated in the local currency of the respective subsidiary (U.S. dollars or Chinese RMB).
We have limited exposure to foreign currency purchases. In each of the three and six months ended September 30, 2020, our purchases in foreign currencies represented 2% of cost of products sold. In the three and six months ended September 30, 2019, our purchases in foreign currencies represented 0% and 1% of cost of products sold, respectively. At certain times, we may enter into forward foreign currency exchange agreements to hedge our exposure against potential unfavorable changes in foreign currency values on significant sales and purchase contracts negotiated in foreign currencies. Forward foreign currency exchange contracts were not used in the periods being reported on in this Quarterly Report on Form 10-Q and as of September 30, 2020 and March 31, 2020, we held no forward foreign currency contracts.
Price Risk
Operating in a global marketplace requires us to compete with other global manufacturers which, in some instances, benefit from lower production costs and more favorable economic conditions. Although we believe that our customers differentiate our products on the basis of our manufacturing quality, responsive and flexible service, and engineering experience and excellence, among other things, such lower production costs and more favorable economic conditions mean that certain of our competitors are able to offer products similar to ours at lower prices. The cost of metals and other materials used in our products can experience significant volatility, and as such, can impact our ability to reflect this volatility in our pricing.
Project Cancellation and Project Continuation Risk
Open orders are reviewed continuously through communications with customers. If it becomes evident to us that a project is delayed well beyond its original shipment date, management will move the project into "placed on hold" (i.e. suspended) category. Furthermore, if a project is cancelled by our customer, it is removed from our backlog. We attempt to mitigate the risk of cancellation by structuring contracts with our customers to maximize the likelihood that progress payments made to us for individual projects cover the costs we have incurred. As a result, we do not believe we have a significant cash exposure to projects which may be cancelled. At September 30, 2020, we had two projects totaling $562 on hold by our customers.
Item 4.Controls and Procedures
Conclusion regarding the effectiveness of disclosure controls and procedures
Our President and Chief Executive Officer (principal executive officer) and Vice President-Finance & Administration and Chief Financial Officer (principal financial officer) each have evaluated the effectiveness of our disclosure controls and procedures (as defined in Exchange Act Rules 13a-15(e) and 15d-15(e)) as of the end of the period covered by this Quarterly Report on Form 10-Q. Based on such evaluation, and as of such date, our President and Chief Executive Officer and Vice President-Finance & Administration and Chief Financial Officer concluded that our disclosure controls and procedures were effective in all material respects.
Changes in internal control over financial reporting
There has been no change to our internal control over financial reporting during the quarter covered by this Quarterly Report on Form 10-Q that has materially affected, or that is reasonably likely to materially affect, our internal control over financial reporting. We have not experienced any material impact to our internal controls over financial reporting despite the fact that most of our non-productive employees were working remotely during the majority of the first quarter due to the COVID-19 pandemic. We are continually monitoring and assessing the COVID-19 situation on our internal controls to minimize the impact on their design and operating effectiveness.
23
GRAHAM CORPORATION AND SUBSIDIARIES
FORM 10-Q
SEPTEMBER 30, 2020
PART II - OTHER INFORMATION
|
Item 1A. |
Risk Factors |
Except as stated below, there have been no material changes from the risk factors previously disclosed in Part I – Item 1A of the Company’s Form 10-K for the fiscal year ended March 31, 2020.
Our business, financial condition and results of operations have been and may continue to be adversely affected by global public health pandemics, including the ongoing COVID-19 pandemic.
Our business, financial condition and results of operations have been and may continue to be adversely affected if the COVID-19 pandemic, or another global health crisis, impacts our employees, suppliers, customers, financing sources or others’ ability to conduct business or negatively affects consumer and business confidence or the global economy. The COVID-19 pandemic has affected large segments of the global economy, including the markets we operate in, since the fourth quarter of fiscal 2020. In response to the COVID-19 pandemic, beginning in late March 2020, we reduced staffing at our facility in Batavia, New York. We began the first quarter of fiscal 2021 at 10% of normal staffing capacity and gradually increased to normal capacity by early June 2020 while applying numerous new health and safety protocols for those working on site.
The pandemic and any additional preventative or protective actions that governments or we may take in response to the COVID-19 pandemic may have a material adverse effect on our business or our suppliers, distribution channels, and customers, including business shutdowns or disruptions for an indefinite period of time, reduced operations, restrictions on shipping, fabricating or installing products, reduced consumer demand or customers’ ability to make payments. We have and may continue to experience additional operating costs due to increased challenges with our workforce (including as a result of illness, absenteeism or government orders), implementing further precautionary measures to protect the health of our workforce, increased project cancellations or projects put on hold, access to supplies, capital, and fundamental support services (such as shipping and transportation). During the first quarter of fiscal 2021 we had two projects on hold, one project cancelled, and three projects delayed by our customers due to the COVID-19 pandemic and related energy market dynamics. Any resulting financial impact from the pandemic cannot be fully estimated at this time, but may materially affect our business, financial condition or results of operations. The extent to which the COVID-19 pandemic affects our results will depend on future developments, which are highly uncertain and cannot be predicted, including new information which may emerge concerning the severity of COVID-19 and the actions to contain the pandemic or treat its impact, among others.
The impact of the COVID-19 pandemic may also exacerbate other risks discussed in Item 1A - Risk Factors of our Form 10-K for the fiscal year ended March 31, 2020, any of which could have a material adverse effect on us. The situation surrounding the COVID-19 pandemic and its impact continue to change rapidly and additional impacts that we are presently unaware of may arise.
24
|
Item 6. |
Exhibits |
INDEX OF EXHIBITS
|
(10) |
|
Material Contracts |
|
|
|
|
|
|
|
|
|
+ |
|
10.1 |
||
|
|
|
|
|
|
|
+ |
|
10.2 |
Pledge Agreement between the Company and HSBC Bank USA, National Association dated August 13, 2020. |
|
|
|
|
|
|
|
|
# |
|
10.3 |
||
|
|
|
|
|
|
|
+# |
|
10.4 |
||
|
(31) |
|
Rule 13a-14(a)/15d-14(a) Certifications |
||
|
|
|
|
|
|
|
+ |
|
31.1 |
||
|
|
|
|
|
|
|
+ |
|
31.2 |
||
|
|
|
|
|
|
|
(32) |
|
Section 1350 Certification |
||
|
|
|
|
|
|
|
+ |
|
32.1 |
||
|
|
|
|
|
|
|
(101) |
|
Interactive Data File |
||
|
|
|
|
|
|
|
+ |
|
101.INS |
Inline XBRL Instance Document – the instance document does not appear in the Interactive Data File because its XBRL tags are embedded within the Inline XBRL document. |
|
|
|
|
|
|
|
|
+ |
|
101.SCH |
Inline XBRL Taxonomy Extension Schema Document |
|
|
|
|
|
|
|
|
+ |
|
101.CAL |
Inline XBRL Taxonomy Extension Calculation Linkbase Document |
|
|
|
|
|
|
|
|
+ |
|
101.DEF |
Inline XBRL Taxonomy Extension Definition Linkbase Document |
|
|
|
|
|
|
|
|
+ |
|
101.LAB |
Inline XBRL Taxonomy Extension Label Linkbase Document |
|
|
|
|
|
|
|
|
+ |
|
101.PRE |
Inline XBRL Taxonomy Extension Presentation Linkbase Document |
|
|
|
|
|
|
|
|
|
|
104 |
Cover Page Interactive Data File (formatted as inline XBRL and contained in Exhibit 101).
+ Exhibit filed with this report
# Management contract or compensation plan |
|
25
SIGNATURES
Pursuant to the requirements of the Securities Exchange Act of 1934, the registrant has duly caused this report to be signed on its behalf by the undersigned thereunto duly authorized.
|
|
GRAHAM CORPORATION
|
||
|
By: |
|
|
/s/ Jeffrey Glajch |
|
|
|
|
Jeffrey Glajch |
|
|
|
|
Vice President-Finance & Administration and |
|
|
|
|
Chief Financial Officer |
|
|
|
|
(On behalf of the Registrant and as Principal Financial Officer) |
Date: October 30, 2020
26