false
2022
Q2
0000716314
--03-31
0.75
0.50
P1Y
0.3333
0.3333
P1Y
true
true
0.3333
P3Y
P3Y
0.3333
P3Y
P5Y
P1Y10M28D
P2Y8M8D
P7Y10M28D
P1Y8M8D
0000716314
2021-04-01
2021-09-30
xbrli:shares
0000716314
2021-10-22
iso4217:USD
0000716314
2021-07-01
2021-09-30
0000716314
2020-07-01
2020-09-30
0000716314
2020-04-01
2020-09-30
iso4217:USD
xbrli:shares
0000716314
2021-09-30
0000716314
2021-03-31
0000716314
us-gaap:CustomerRelationshipsMember
2021-09-30
0000716314
ghm:TechnologyAndTechnicalKnowHowMember
2021-09-30
0000716314
2020-03-31
0000716314
2020-09-30
0000716314
us-gaap:CommonStockMember
2021-03-31
0000716314
us-gaap:AdditionalPaidInCapitalMember
2021-03-31
0000716314
us-gaap:RetainedEarningsMember
2021-03-31
0000716314
us-gaap:AccumulatedOtherComprehensiveIncomeMember
2021-03-31
0000716314
us-gaap:TreasuryStockMember
2021-03-31
0000716314
us-gaap:RetainedEarningsMember
2021-04-01
2021-06-30
0000716314
us-gaap:AccumulatedOtherComprehensiveIncomeMember
2021-04-01
2021-06-30
0000716314
2021-04-01
2021-06-30
0000716314
us-gaap:CommonStockMember
2021-04-01
2021-06-30
0000716314
us-gaap:AdditionalPaidInCapitalMember
2021-04-01
2021-06-30
0000716314
us-gaap:TreasuryStockMember
2021-04-01
2021-06-30
0000716314
us-gaap:CommonStockMember
2021-06-30
0000716314
us-gaap:AdditionalPaidInCapitalMember
2021-06-30
0000716314
us-gaap:RetainedEarningsMember
2021-06-30
0000716314
us-gaap:AccumulatedOtherComprehensiveIncomeMember
2021-06-30
0000716314
us-gaap:TreasuryStockMember
2021-06-30
0000716314
2021-06-30
0000716314
us-gaap:RetainedEarningsMember
2021-07-01
2021-09-30
0000716314
us-gaap:AccumulatedOtherComprehensiveIncomeMember
2021-07-01
2021-09-30
0000716314
us-gaap:CommonStockMember
2021-07-01
2021-09-30
0000716314
us-gaap:AdditionalPaidInCapitalMember
2021-07-01
2021-09-30
0000716314
us-gaap:TreasuryStockMember
2021-07-01
2021-09-30
0000716314
us-gaap:CommonStockMember
2021-09-30
0000716314
us-gaap:AdditionalPaidInCapitalMember
2021-09-30
0000716314
us-gaap:RetainedEarningsMember
2021-09-30
0000716314
us-gaap:AccumulatedOtherComprehensiveIncomeMember
2021-09-30
0000716314
us-gaap:TreasuryStockMember
2021-09-30
0000716314
us-gaap:CommonStockMember
2020-03-31
0000716314
us-gaap:AdditionalPaidInCapitalMember
2020-03-31
0000716314
us-gaap:RetainedEarningsMember
2020-03-31
0000716314
us-gaap:AccumulatedOtherComprehensiveIncomeMember
2020-03-31
0000716314
us-gaap:TreasuryStockMember
2020-03-31
0000716314
us-gaap:RetainedEarningsMember
2020-04-01
2020-06-30
0000716314
us-gaap:AccumulatedOtherComprehensiveIncomeMember
2020-04-01
2020-06-30
0000716314
2020-04-01
2020-06-30
0000716314
us-gaap:CommonStockMember
2020-04-01
2020-06-30
0000716314
us-gaap:AdditionalPaidInCapitalMember
2020-04-01
2020-06-30
0000716314
us-gaap:TreasuryStockMember
2020-04-01
2020-06-30
0000716314
us-gaap:CommonStockMember
2020-06-30
0000716314
us-gaap:AdditionalPaidInCapitalMember
2020-06-30
0000716314
us-gaap:RetainedEarningsMember
2020-06-30
0000716314
us-gaap:AccumulatedOtherComprehensiveIncomeMember
2020-06-30
0000716314
us-gaap:TreasuryStockMember
2020-06-30
0000716314
2020-06-30
0000716314
us-gaap:RetainedEarningsMember
2020-07-01
2020-09-30
0000716314
us-gaap:AccumulatedOtherComprehensiveIncomeMember
2020-07-01
2020-09-30
0000716314
us-gaap:AdditionalPaidInCapitalMember
2020-07-01
2020-09-30
0000716314
us-gaap:TreasuryStockMember
2020-07-01
2020-09-30
0000716314
us-gaap:CommonStockMember
2020-09-30
0000716314
us-gaap:AdditionalPaidInCapitalMember
2020-09-30
0000716314
us-gaap:RetainedEarningsMember
2020-09-30
0000716314
us-gaap:AccumulatedOtherComprehensiveIncomeMember
2020-09-30
0000716314
us-gaap:TreasuryStockMember
2020-09-30
0000716314
us-gaap:PensionPlansDefinedBenefitMember
2021-04-01
2021-09-30
0000716314
us-gaap:OtherPostretirementBenefitPlansDefinedBenefitMember
2021-04-01
2021-09-30
0000716314
ghm:BarberNicholsIncMember
2021-06-01
2021-06-01
0000716314
ghm:BarberNicholsIncMember
2021-06-01
0000716314
ghm:BarberNicholsIncMember
srt:MaximumMember
2021-06-01
0000716314
ghm:BarberNicholsIncMember
2021-06-30
xbrli:pure
0000716314
ghm:BarberNicholsIncMember
2021-04-01
2021-09-30
0000716314
ghm:BarberNicholsIncMember
2021-07-01
2021-09-30
0000716314
ghm:BarberNicholsIncMember
2021-09-30
0000716314
us-gaap:CustomerRelationshipsMember
ghm:BarberNicholsIncMember
2021-04-01
2021-09-30
0000716314
ghm:TechnologyAndTechnicalKnowHowMember
ghm:BarberNicholsIncMember
2021-04-01
2021-09-30
0000716314
ghm:BacklogMember
ghm:BarberNicholsIncMember
2021-04-01
2021-09-30
0000716314
us-gaap:TradeNamesMember
ghm:BarberNicholsIncMember
2021-04-01
2021-09-30
0000716314
ghm:BacklogMember
ghm:BarberNicholsIncMember
2021-06-01
0000716314
us-gaap:CustomerRelationshipsMember
ghm:BarberNicholsIncMember
2021-06-01
0000716314
ghm:TechnologyAndTechnicalKnowHowMember
ghm:BarberNicholsIncMember
2021-06-01
0000716314
ghm:TradenameMember
ghm:BarberNicholsIncMember
2021-06-01
0000716314
ghm:BarberNicholsIncMember
2020-07-01
2020-09-30
0000716314
ghm:BarberNicholsIncMember
2020-04-01
2020-09-30
0000716314
ghm:HeatTransferEquipmentMember
2021-07-01
2021-09-30
0000716314
ghm:HeatTransferEquipmentMember
2020-07-01
2020-09-30
0000716314
ghm:HeatTransferEquipmentMember
2021-04-01
2021-09-30
0000716314
ghm:HeatTransferEquipmentMember
2020-04-01
2020-09-30
0000716314
ghm:VacuumEquipmentMember
2021-07-01
2021-09-30
0000716314
ghm:VacuumEquipmentMember
2020-07-01
2020-09-30
0000716314
ghm:VacuumEquipmentMember
2021-04-01
2021-09-30
0000716314
ghm:VacuumEquipmentMember
2020-04-01
2020-09-30
0000716314
ghm:FluidSystemsMember
2021-07-01
2021-09-30
0000716314
ghm:FluidSystemsMember
2021-04-01
2021-09-30
0000716314
ghm:PowerSystemsMember
2021-07-01
2021-09-30
0000716314
ghm:PowerSystemsMember
2021-04-01
2021-09-30
0000716314
ghm:AllOtherProductLinesMember
2021-07-01
2021-09-30
0000716314
ghm:AllOtherProductLinesMember
2020-07-01
2020-09-30
0000716314
ghm:AllOtherProductLinesMember
2021-04-01
2021-09-30
0000716314
ghm:AllOtherProductLinesMember
2020-04-01
2020-09-30
0000716314
srt:AsiaMember
2021-07-01
2021-09-30
0000716314
srt:AsiaMember
2020-07-01
2020-09-30
0000716314
srt:AsiaMember
2021-04-01
2021-09-30
0000716314
srt:AsiaMember
2020-04-01
2020-09-30
0000716314
country:CA
2021-07-01
2021-09-30
0000716314
country:CA
2020-07-01
2020-09-30
0000716314
country:CA
2021-04-01
2021-09-30
0000716314
country:CA
2020-04-01
2020-09-30
0000716314
us-gaap:MiddleEastMember
2021-07-01
2021-09-30
0000716314
us-gaap:MiddleEastMember
2020-07-01
2020-09-30
0000716314
us-gaap:MiddleEastMember
2021-04-01
2021-09-30
0000716314
us-gaap:MiddleEastMember
2020-04-01
2020-09-30
0000716314
srt:SouthAmericaMember
2021-07-01
2021-09-30
0000716314
srt:SouthAmericaMember
2020-07-01
2020-09-30
0000716314
srt:SouthAmericaMember
2021-04-01
2021-09-30
0000716314
srt:SouthAmericaMember
2020-04-01
2020-09-30
0000716314
country:US
2021-07-01
2021-09-30
0000716314
country:US
2020-07-01
2020-09-30
0000716314
country:US
2021-04-01
2021-09-30
0000716314
country:US
2020-04-01
2020-09-30
0000716314
ghm:AllOtherCountriesMember
2021-07-01
2021-09-30
0000716314
ghm:AllOtherCountriesMember
2020-07-01
2020-09-30
0000716314
ghm:AllOtherCountriesMember
2021-04-01
2021-09-30
0000716314
ghm:AllOtherCountriesMember
2020-04-01
2020-09-30
0000716314
ghm:CustomerDepositsMember
2021-09-30
0000716314
ghm:CustomerDepositsMember
2021-03-31
0000716314
ghm:BarberNicholsLLCMember
2021-04-01
2021-09-30
0000716314
us-gaap:PrepaidExpensesAndOtherCurrentAssetsMember
2021-09-30
0000716314
us-gaap:PrepaidExpensesAndOtherCurrentAssetsMember
2021-03-31
0000716314
srt:MinimumMember
2021-10-01
2021-09-30
0000716314
srt:MaximumMember
2021-10-01
2021-09-30
0000716314
srt:MinimumMember
2022-10-01
2021-09-30
0000716314
srt:MaximumMember
2022-10-01
2021-09-30
0000716314
2023-10-01
2021-09-30
0000716314
srt:MinimumMember
2021-04-01
2021-09-30
0000716314
srt:MaximumMember
2021-04-01
2021-09-30
0000716314
ghm:TwoThousandIncentivePlanMember
srt:MaximumMember
us-gaap:StockCompensationPlanMember
2021-09-30
0000716314
ghm:TwoThousandIncentivePlanMember
ghm:StockCompensationPriorPlanMember
2021-09-30
0000716314
ghm:TwoThousandIncentivePlanMember
us-gaap:EmployeeStockOptionMember
2020-08-11
2020-08-11
0000716314
ghm:TwoThousandIncentivePlanMember
us-gaap:EmployeeStockOptionMember
2020-08-11
0000716314
ghm:TwoThousandIncentivePlanMember
us-gaap:RestrictedStockMember
2020-08-11
0000716314
ghm:PerformanceVestedRestrictedStockMember
us-gaap:RestrictedStockMember
ghm:TwoThousandIncentivePlanMember
2021-07-01
2021-09-30
0000716314
ghm:PerformanceVestedRestrictedStockMember
us-gaap:RestrictedStockMember
ghm:TwoThousandIncentivePlanMember
2021-04-01
2021-09-30
0000716314
ghm:PerformanceVestedRestrictedStockMember
us-gaap:RestrictedStockMember
ghm:TwoThousandIncentivePlanMember
2020-04-01
2020-09-30
0000716314
srt:OfficerMember
ghm:PerformanceVestedRestrictedStockMember
us-gaap:RestrictedStockMember
ghm:TwoThousandIncentivePlanMember
2021-07-01
2021-09-30
0000716314
srt:OfficerMember
ghm:PerformanceVestedRestrictedStockMember
us-gaap:RestrictedStockMember
ghm:TwoThousandIncentivePlanMember
2020-04-01
2021-03-31
0000716314
srt:OfficerMember
ghm:PerformanceVestedRestrictedStockMember
us-gaap:RestrictedStockMember
ghm:TwoThousandIncentivePlanMember
srt:ScenarioForecastMember
2021-04-01
2022-03-31
0000716314
srt:OfficerMember
ghm:PerformanceVestedRestrictedStockMember
us-gaap:RestrictedStockMember
ghm:TwoThousandIncentivePlanMember
2021-04-01
2021-09-30
0000716314
ghm:OfficersAndKeyEmployeesMember
ghm:TimeVestedRestrictedStockMember
us-gaap:RestrictedStockMember
ghm:TwoThousandIncentivePlanMember
2021-07-01
2021-09-30
0000716314
ghm:OfficersAndKeyEmployeesMember
ghm:TimeVestedRestrictedStockMember
us-gaap:RestrictedStockMember
ghm:TwoThousandIncentivePlanMember
2020-04-01
2021-03-31
0000716314
ghm:OfficersAndKeyEmployeesMember
ghm:TimeVestedRestrictedStockMember
us-gaap:RestrictedStockMember
ghm:TwoThousandIncentivePlanMember
srt:ScenarioForecastMember
2021-04-01
2022-03-31
0000716314
ghm:OfficersAndKeyEmployeesMember
ghm:TimeVestedRestrictedStockMember
us-gaap:RestrictedStockMember
ghm:TwoThousandIncentivePlanMember
2021-04-01
2021-09-30
0000716314
srt:DirectorMember
ghm:TimeVestedRestrictedStockMember
us-gaap:RestrictedStockMember
ghm:TwoThousandIncentivePlanMember
2020-04-01
2021-03-31
0000716314
srt:DirectorMember
ghm:TimeVestedRestrictedStockMember
us-gaap:RestrictedStockMember
ghm:TwoThousandIncentivePlanMember
srt:ScenarioForecastMember
2021-04-01
2022-03-31
0000716314
srt:DirectorMember
ghm:TimeVestedRestrictedStockMember
us-gaap:RestrictedStockMember
ghm:TwoThousandIncentivePlanMember
2021-04-01
2021-09-30
0000716314
us-gaap:EmployeeStockOptionMember
ghm:TwoThousandIncentivePlanMember
2021-04-01
2021-09-30
0000716314
us-gaap:EmployeeStockOptionMember
ghm:TwoThousandIncentivePlanMember
2020-04-01
2020-09-30
0000716314
us-gaap:StockCompensationPlanMember
2021-07-01
2021-09-30
0000716314
us-gaap:StockCompensationPlanMember
2020-07-01
2020-09-30
0000716314
us-gaap:StockCompensationPlanMember
2021-04-01
2021-09-30
0000716314
us-gaap:StockCompensationPlanMember
2020-04-01
2020-09-30
0000716314
ghm:EmployeeStockPurchasePlanMember
2021-07-01
2021-09-30
0000716314
ghm:EmployeeStockPurchasePlanMember
2021-09-30
0000716314
ghm:EmployeeStockPurchasePlanMember
2020-07-01
2020-09-30
0000716314
ghm:EmployeeStockPurchasePlanMember
2021-04-01
2021-09-30
0000716314
ghm:EmployeeStockPurchasePlanMember
2020-04-01
2020-09-30
0000716314
us-gaap:PensionPlansDefinedBenefitMember
2021-07-01
2021-09-30
0000716314
us-gaap:PensionPlansDefinedBenefitMember
2020-07-01
2020-09-30
0000716314
us-gaap:PensionPlansDefinedBenefitMember
2020-04-01
2020-09-30
0000716314
us-gaap:PensionPlansDefinedBenefitMember
2021-09-30
0000716314
us-gaap:PensionPlansDefinedBenefitMember
us-gaap:OtherComprehensiveIncomeMember
2021-07-01
2021-09-30
0000716314
us-gaap:OtherPostretirementBenefitPlansDefinedBenefitMember
2021-07-01
2021-09-30
0000716314
us-gaap:OtherPostretirementBenefitPlansDefinedBenefitMember
2020-07-01
2020-09-30
0000716314
us-gaap:OtherPostretirementBenefitPlansDefinedBenefitMember
2020-04-01
2020-09-30
0000716314
us-gaap:OtherPostretirementBenefitPlansDefinedBenefitMember
2021-09-30
0000716314
us-gaap:EarliestTaxYearMember
us-gaap:DomesticCountryMember
2021-04-01
2021-09-30
0000716314
us-gaap:EarliestTaxYearMember
us-gaap:StateAndLocalJurisdictionMember
2021-04-01
2021-09-30
0000716314
us-gaap:EarliestTaxYearMember
us-gaap:ForeignCountryMember
us-gaap:StateAdministrationOfTaxationChinaMember
2021-04-01
2021-09-30
0000716314
us-gaap:EarliestTaxYearMember
us-gaap:ForeignCountryMember
us-gaap:MinistryOfFinanceIndiaMember
2021-04-01
2021-09-30
0000716314
us-gaap:LatestTaxYearMember
us-gaap:DomesticCountryMember
2021-04-01
2021-09-30
0000716314
us-gaap:LatestTaxYearMember
us-gaap:StateAndLocalJurisdictionMember
2021-04-01
2021-09-30
0000716314
us-gaap:LatestTaxYearMember
us-gaap:ForeignCountryMember
us-gaap:StateAdministrationOfTaxationChinaMember
2021-04-01
2021-09-30
0000716314
us-gaap:LatestTaxYearMember
us-gaap:ForeignCountryMember
us-gaap:MinistryOfFinanceIndiaMember
2021-04-01
2021-09-30
0000716314
us-gaap:AccumulatedDefinedBenefitPlansAdjustmentMember
2021-03-31
0000716314
us-gaap:AccumulatedTranslationAdjustmentMember
2021-03-31
0000716314
us-gaap:AccumulatedDefinedBenefitPlansAdjustmentMember
2021-04-01
2021-09-30
0000716314
us-gaap:AccumulatedTranslationAdjustmentMember
2021-04-01
2021-09-30
0000716314
us-gaap:AccumulatedDefinedBenefitPlansAdjustmentMember
2021-09-30
0000716314
us-gaap:AccumulatedTranslationAdjustmentMember
2021-09-30
0000716314
us-gaap:AccumulatedDefinedBenefitPlansAdjustmentMember
2020-03-31
0000716314
us-gaap:AccumulatedTranslationAdjustmentMember
2020-03-31
0000716314
us-gaap:AccumulatedTranslationAdjustmentMember
2020-04-01
2020-09-30
0000716314
us-gaap:AccumulatedDefinedBenefitPlansAdjustmentMember
2020-04-01
2020-09-30
0000716314
us-gaap:AccumulatedDefinedBenefitPlansAdjustmentMember
2020-09-30
0000716314
us-gaap:AccumulatedTranslationAdjustmentMember
2020-09-30
0000716314
us-gaap:ReclassificationOutOfAccumulatedOtherComprehensiveIncomeMember
ghm:AccumulatedDefinedBenefitPlansAdjustmentNetActuarialGainLossesMember
2021-07-01
2021-09-30
0000716314
us-gaap:ReclassificationOutOfAccumulatedOtherComprehensiveIncomeMember
ghm:AccumulatedDefinedBenefitPlansAdjustmentNetActuarialGainLossesMember
2020-07-01
2020-09-30
0000716314
us-gaap:ReclassificationOutOfAccumulatedOtherComprehensiveIncomeMember
us-gaap:AccumulatedDefinedBenefitPlansAdjustmentMember
2021-07-01
2021-09-30
0000716314
us-gaap:ReclassificationOutOfAccumulatedOtherComprehensiveIncomeMember
us-gaap:AccumulatedDefinedBenefitPlansAdjustmentMember
2020-07-01
2020-09-30
0000716314
us-gaap:ReclassificationOutOfAccumulatedOtherComprehensiveIncomeMember
ghm:AccumulatedDefinedBenefitPlansAdjustmentNetActuarialGainLossesMember
2021-04-01
2021-09-30
0000716314
us-gaap:ReclassificationOutOfAccumulatedOtherComprehensiveIncomeMember
ghm:AccumulatedDefinedBenefitPlansAdjustmentNetActuarialGainLossesMember
2020-04-01
2020-09-30
0000716314
us-gaap:ReclassificationOutOfAccumulatedOtherComprehensiveIncomeMember
us-gaap:AccumulatedDefinedBenefitPlansAdjustmentMember
2021-04-01
2021-09-30
0000716314
us-gaap:ReclassificationOutOfAccumulatedOtherComprehensiveIncomeMember
us-gaap:AccumulatedDefinedBenefitPlansAdjustmentMember
2020-04-01
2020-09-30
0000716314
ghm:FiveYearTermLoanWithBankOfAmericaMember
2021-06-01
0000716314
ghm:FiveYearTermLoanWithBankOfAmericaMember
2021-06-01
2021-06-01
0000716314
ghm:BloombergShortTermBankYieldIndexMember
ghm:FiveYearTermLoanWithBankOfAmericaMember
2021-06-01
2021-06-01
0000716314
ghm:FloorRateMember
ghm:FiveYearTermLoanWithBankOfAmericaMember
2021-06-01
2021-06-01
0000716314
us-gaap:LineOfCreditMember
2021-06-01
0000716314
us-gaap:LineOfCreditMember
2021-09-30
0000716314
us-gaap:LineOfCreditMember
ghm:BloombergShortTermBankYieldIndexMember
2021-06-01
2021-06-01
0000716314
us-gaap:LineOfCreditMember
ghm:FloorRateMember
2021-06-01
2021-06-01
0000716314
us-gaap:LineOfCreditMember
2021-04-01
2021-09-30
0000716314
us-gaap:LetterOfCreditMember
2021-06-01
2021-06-01
0000716314
ghm:LetterOfCreditSecuredByCashMember
2021-06-01
2021-06-01
0000716314
2021-06-01
2021-06-01
0000716314
ghm:HSBCBankUSAMember
us-gaap:LetterOfCreditMember
2021-06-01
0000716314
ghm:HSBCBankUSAMember
us-gaap:LetterOfCreditMember
2021-05-31
0000716314
us-gaap:RevolvingCreditFacilityMember
us-gaap:LetterOfCreditMember
2021-06-01
2021-06-01
0000716314
us-gaap:RevolvingCreditFacilityMember
us-gaap:LetterOfCreditMember
srt:MinimumMember
2021-06-01
2021-06-01
0000716314
us-gaap:RevolvingCreditFacilityMember
us-gaap:LetterOfCreditMember
srt:MaximumMember
2021-06-01
2021-06-01
0000716314
us-gaap:RevolvingCreditFacilityMember
us-gaap:LetterOfCreditMember
us-gaap:PrimeRateMember
2021-06-01
2021-06-01
0000716314
us-gaap:AccountingStandardsUpdate201912Member
2021-09-30
0000716314
us-gaap:OtherOperatingIncomeExpenseMember
ghm:TransactionAgreementMember
2021-09-30
0000716314
us-gaap:OtherOperatingIncomeExpenseMember
ghm:BarberNicholsIncMember
2021-09-30
UNITED STATES
SECURITIES AND EXCHANGE COMMISSION
WASHINGTON, D.C. 20549
FORM 10-Q
(Mark One)
|
☒ |
QUARTERLY REPORT PURSUANT TO SECTION 13 OR 15(d) OF THE SECURITIES EXCHANGE ACT OF 1934 |
For the quarterly period ended September 30, 2021
or
|
☐ |
TRANSITION REPORT PURSUANT TO SECTION 13 OR 15(d) OF THE SECURITIES EXCHANGE ACT OF 1934 |
For the transition period from _____________ to ___________
Commission File Number 1-8462
GRAHAM CORPORATION
(Exact name of registrant as specified in its charter)
|
|
|
Delaware |
16-1194720 |
|
(State or other jurisdiction of
incorporation or organization) |
(I.R.S. Employer
Identification No.) |
|
20 Florence Avenue, Batavia, New York |
14020 |
|
(Address of principal executive offices) |
(Zip Code) |
585-343-2216
(Registrant's telephone number, including area code)
Securities registered pursuant to Section 12(b) of the Act:
|
Title of each class |
|
Trading
Symbol(s) |
|
Name of each exchange on which registered |
|
Common Stock, Par Value $0.10 Per Share |
|
GHM |
|
NYSE |
Indicate by check mark whether the registrant (1) has filed all reports required to be filed by Section 13 or 15(d) of the Securities Exchange Act of 1934 during the preceding 12 months (or for such shorter period that the registrant was required to file such reports), and (2) has been subject to such filing requirements for the past 90 days. Yes ☒ No ☐
Indicate by check mark whether the registrant has submitted electronically every Interactive Data File required to be submitted pursuant to Rule 405 of Regulation S-T (§232.405 of this chapter) during the preceding 12 months (or for such shorter period that the registrant was required to submit such files). Yes ☒ No ☐
Indicate by check mark whether the registrant is a large accelerated filer, an accelerated filer, a non-accelerated filer, a smaller reporting company, or an emerging growth company. See the definitions of "large accelerated filer," "accelerated filer," "smaller reporting company," and "emerging growth company" in Rule 12b-2 of the Exchange Act.
|
Large accelerated filer |
☐ |
|
Accelerated filer |
☐ |
|
Non-accelerated filer |
☒ |
|
Smaller reporting company |
☒ |
|
Emerging growth company |
☐ |
|
|
|
If an emerging growth company, indicate by check mark if the registrant has elected not to use the extended transition period for complying with any new or revised financial accounting standards provided pursuant to Section 13(a) of the Exchange Act. ☐
Indicate by check mark whether the registrant is a shell company (as defined in Rule 12b-2 of the Exchange Act).
Yes ☐ No ☒
As of October 22, 2021, there were outstanding 10,638,041 shares of the registrant’s common stock, par value $0.10 per share.
Graham Corporation and Subsidiaries
Index to Form 10-Q
As of September 30, 2021 and March 31, 2021 and for the three and six months ended September 30, 2021 and 2020
2
GRAHAM CORPORATION AND SUBSIDIARIES
FORM 10-Q
SEPTEMBER 30, 2021
PART I – FINANCIAL INFORMATION
Item 1.Unaudited Condensed Consolidated Financial Statements
GRAHAM CORPORATION AND SUBSIDIARIES
CONDENSED CONSOLIDATED STATEMENTS OF OPERATIONS
(Unaudited)
|
|
|
Three Months Ended |
|
|
Six Months Ended |
|
|
|
|
September 30, |
|
|
September 30, |
|
|
|
|
2021 |
|
|
2020 |
|
|
2021 |
|
|
2020 |
|
|
|
|
(Amounts in thousands, except per share data) |
|
|
(Amounts in thousands, except per share data) |
|
|
Net sales |
|
$ |
34,146 |
|
|
$ |
27,954 |
|
|
$ |
54,303 |
|
|
$ |
44,664 |
|
|
Cost of products sold |
|
|
30,703 |
|
|
|
20,261 |
|
|
|
49,946 |
|
|
|
35,403 |
|
|
Gross profit |
|
|
3,443 |
|
|
|
7,693 |
|
|
|
4,357 |
|
|
|
9,261 |
|
|
Other expenses and income: |
|
|
|
|
|
|
|
|
|
|
|
|
|
|
|
|
|
Selling, general and administrative |
|
|
4,973 |
|
|
|
4,253 |
|
|
|
9,805 |
|
|
|
8,155 |
|
|
Selling, general and administrative – amortization |
|
|
274 |
|
|
|
— |
|
|
|
365 |
|
|
|
— |
|
|
Other operating income, net |
|
|
(1,102 |
) |
|
|
— |
|
|
|
(1,102 |
) |
|
|
— |
|
|
Operating (loss) income |
|
|
(702 |
) |
|
|
3,440 |
|
|
|
(4,711 |
) |
|
|
1,106 |
|
|
Other income |
|
|
(145 |
) |
|
|
(54 |
) |
|
|
(305 |
) |
|
|
(109 |
) |
|
Interest income |
|
|
(14 |
) |
|
|
(26 |
) |
|
|
(31 |
) |
|
|
(120 |
) |
|
Interest expense |
|
|
129 |
|
|
|
3 |
|
|
|
168 |
|
|
|
8 |
|
|
(Loss) income before benefit for income taxes |
|
|
(672 |
) |
|
|
3,517 |
|
|
|
(4,543 |
) |
|
|
1,327 |
|
|
(Benefit) expense for income taxes |
|
|
(180 |
) |
|
|
773 |
|
|
|
(925 |
) |
|
|
401 |
|
|
Net (loss) income |
|
$ |
(492 |
) |
|
$ |
2,744 |
|
|
$ |
(3,618 |
) |
|
$ |
926 |
|
|
Per share data |
|
|
|
|
|
|
|
|
|
|
|
|
|
|
|
|
|
Basic: |
|
|
|
|
|
|
|
|
|
|
|
|
|
|
|
|
|
Net (loss) income |
|
$ |
(0.05 |
) |
|
$ |
0.27 |
|
|
$ |
(0.35 |
) |
|
$ |
0.09 |
|
|
Diluted: |
|
|
|
|
|
|
|
|
|
|
|
|
|
|
|
|
|
Net (loss) income |
|
$ |
(0.05 |
) |
|
$ |
0.27 |
|
|
$ |
(0.35 |
) |
|
$ |
0.09 |
|
|
Weighted average common shares
outstanding: |
|
|
|
|
|
|
|
|
|
|
|
|
|
|
|
|
|
Basic |
|
|
10,681 |
|
|
|
9,977 |
|
|
|
10,442 |
|
|
|
9,936 |
|
|
Diluted |
|
|
10,681 |
|
|
|
9,977 |
|
|
|
10,442 |
|
|
|
9,936 |
|
|
Dividends declared per share |
|
$ |
0.11 |
|
|
$ |
0.11 |
|
|
$ |
0.22 |
|
|
$ |
0.22 |
|
See Notes to Condensed Consolidated Financial Statements.
3
GRAHAM CORPORATION AND SUBSIDIARIES
CONDENSED CONSOLIDATED STATEMENTS OF COMPREHENSIVE (LOSS) INCOME
(Unaudited)
|
|
|
Three Months Ended |
|
|
Six Months Ended |
|
|
|
|
September 30, |
|
|
September 30, |
|
|
|
|
2021 |
|
|
2020 |
|
|
2021 |
|
|
2020 |
|
|
|
|
(Amounts in thousands) |
|
|
(Amounts in thousands) |
|
|
Net (loss) income |
|
$ |
(492 |
) |
|
$ |
2,744 |
|
|
$ |
(3,618 |
) |
|
$ |
926 |
|
|
Other comprehensive income: |
|
|
|
|
|
|
|
|
|
|
|
|
|
|
|
|
|
Foreign currency translation adjustment |
|
|
(35 |
) |
|
|
146 |
|
|
|
93 |
|
|
|
155 |
|
|
Defined benefit pension and other postretirement plans net
of income tax expense of $72 and $63 for the three months
ended September 30, 2021 and 2020, respectively, and $121
and $124 for the six months ended September 30, 2021 and
2020, respectively |
|
|
251 |
|
|
|
204 |
|
|
|
421 |
|
|
|
409 |
|
|
Total other comprehensive income |
|
|
216 |
|
|
|
350 |
|
|
|
514 |
|
|
|
564 |
|
|
Total comprehensive (loss) income |
|
$ |
(276 |
) |
|
$ |
3,094 |
|
|
$ |
(3,104 |
) |
|
$ |
1,490 |
|
See Notes to Condensed Consolidated Financial Statements.
4
GRAHAM CORPORATION AND SUBSIDIARIES
CONDENSED CONSOLIDATED BALANCE SHEETS
(Unaudited)
|
|
|
September 30, 2021 |
|
|
March 31, 2021 |
|
|
|
|
(Amounts in thousands, except per share data) |
|
|
Assets |
|
|
|
|
|
|
|
|
|
Current assets: |
|
|
|
|
|
|
|
|
|
Cash and cash equivalents |
|
$ |
16,463 |
|
|
$ |
59,532 |
|
|
Investments |
|
|
— |
|
|
|
5,500 |
|
|
Trade accounts receivable, net of allowances ($62 and $29 at September 30 and
March 31, 2021, respectively) |
|
|
27,878 |
|
|
|
17,378 |
|
|
Unbilled revenue |
|
|
29,035 |
|
|
|
19,994 |
|
|
Inventories |
|
|
17,722 |
|
|
|
17,332 |
|
|
Prepaid expenses and other current assets |
|
|
2,193 |
|
|
|
512 |
|
|
Income taxes receivable |
|
|
2,149 |
|
|
|
— |
|
|
Total current assets |
|
|
95,440 |
|
|
|
120,248 |
|
|
Property, plant and equipment, net |
|
|
25,336 |
|
|
|
17,618 |
|
|
Prepaid pension asset |
|
|
6,819 |
|
|
|
6,216 |
|
|
Operating lease assets |
|
|
9,016 |
|
|
|
95 |
|
|
Goodwill |
|
|
22,823 |
|
|
|
— |
|
|
Customer relationships |
|
|
11,603 |
|
|
|
— |
|
|
Technology and technical know how |
|
|
9,932 |
|
|
|
— |
|
|
Other intangible assets, net |
|
|
10,656 |
|
|
|
— |
|
|
Other assets |
|
|
211 |
|
|
|
103 |
|
|
Total assets |
|
$ |
191,836 |
|
|
$ |
144,280 |
|
|
Liabilities and stockholders’ equity |
|
|
|
|
|
|
|
|
|
Current liabilities: |
|
|
|
|
|
|
|
|
|
Short-term debt obligations |
|
$ |
4,000 |
|
|
$ |
— |
|
|
Current portion of long-term debt |
|
|
2,000 |
|
|
|
— |
|
|
Current portion of finance lease obligations |
|
|
22 |
|
|
|
21 |
|
|
Accounts payable |
|
|
16,139 |
|
|
|
17,972 |
|
|
Accrued compensation |
|
|
8,156 |
|
|
|
6,106 |
|
|
Accrued expenses and other current liabilities |
|
|
5,511 |
|
|
|
4,628 |
|
|
Customer deposits |
|
|
21,941 |
|
|
|
14,059 |
|
|
Operating lease liabilities |
|
|
1,131 |
|
|
|
46 |
|
|
Income taxes payable |
|
|
— |
|
|
|
741 |
|
|
Total current liabilities |
|
|
58,900 |
|
|
|
43,573 |
|
|
Long-term debt |
|
|
17,500 |
|
|
|
— |
|
|
Finance lease obligations |
|
|
23 |
|
|
|
34 |
|
|
Operating lease liabilities |
|
|
7,958 |
|
|
|
37 |
|
|
Deferred income tax liability |
|
|
1,455 |
|
|
|
635 |
|
|
Accrued pension and postretirement benefit liabilities |
|
|
1,945 |
|
|
|
2,072 |
|
|
Other long-term liabilities |
|
|
2,203 |
|
|
|
— |
|
|
Total liabilities |
|
|
89,984 |
|
|
|
46,351 |
|
|
Commitments and contingencies (Note 11) |
|
|
|
|
|
|
|
|
|
Stockholders’ equity: |
|
|
|
|
|
|
|
|
|
Preferred stock, $1.00 par value, 500 shares authorized |
|
|
— |
|
|
|
— |
|
|
Common stock, $0.10 par value, 25,500 shares authorized, 10,810 and 10,748 shares
issued and 10,638 and 9,959 shares outstanding at September 30 and March 31, 2021,
respectively |
|
|
1,081 |
|
|
|
1,075 |
|
|
Capital in excess of par value |
|
|
27,339 |
|
|
|
27,272 |
|
|
Retained earnings |
|
|
83,400 |
|
|
|
89,372 |
|
|
Accumulated other comprehensive loss |
|
|
(6,883 |
) |
|
|
(7,397 |
) |
|
Treasury stock (172 and 790 shares at September 30 and March 31, 2021, respectively) |
|
|
(3,085 |
) |
|
|
(12,393 |
) |
|
Total stockholders’ equity |
|
|
101,852 |
|
|
|
97,929 |
|
|
Total liabilities and stockholders’ equity |
|
$ |
191,836 |
|
|
$ |
144,280 |
|
See Notes to Condensed Consolidated Financial Statements.
5
GRAHAM CORPORATION AND SUBSIDIARIES
CONDENSED CONSOLIDATED STATEMENTS OF CASH FLOWS
(Unaudited)
|
|
|
Six Months Ended |
|
|
|
|
September 30, |
|
|
|
|
2021 |
|
|
2020 |
|
|
Operating activities: |
|
(Dollar amounts in thousands) |
|
|
Net (loss) income |
|
$ |
(3,618 |
) |
|
$ |
926 |
|
|
Adjustments to reconcile net (loss) income to net cash used by operating
activities: |
|
|
|
|
|
|
|
|
|
Depreciation |
|
|
1,399 |
|
|
|
972 |
|
|
Amortization |
|
|
1,009 |
|
|
|
— |
|
|
Amortization of actuarial losses |
|
|
455 |
|
|
|
533 |
|
|
Equity-based compensation expense |
|
|
330 |
|
|
|
494 |
|
|
Gain on disposal or sale of property, plant and equipment |
|
|
13 |
|
|
|
3 |
|
|
Change in fair value of contingent consideration |
|
|
(1,900 |
) |
|
|
— |
|
|
Deferred income taxes |
|
|
693 |
|
|
|
191 |
|
|
(Increase) decrease in operating assets: |
|
|
|
|
|
|
|
|
|
Accounts receivable |
|
|
(2,289 |
) |
|
|
(3,820 |
) |
|
Unbilled revenue |
|
|
(1,944 |
) |
|
|
901 |
|
|
Inventories |
|
|
3,278 |
|
|
|
1,808 |
|
|
Prepaid expenses and other current and non-current assets |
|
|
(1,233 |
) |
|
|
(456 |
) |
|
Income taxes receivable |
|
|
(2,894 |
) |
|
|
163 |
|
|
Operating lease assets |
|
|
432 |
|
|
|
75 |
|
|
Prepaid pension asset |
|
|
(603 |
) |
|
|
(421 |
) |
|
Increase (decrease) in operating liabilities: |
|
|
|
|
|
|
|
|
|
Accounts payable |
|
|
(4,477 |
) |
|
|
(2,544 |
) |
|
Accrued compensation, accrued expenses and other current and non-current
liabilities |
|
|
779 |
|
|
|
1,214 |
|
|
Customer deposits |
|
|
1,835 |
|
|
|
(2,285 |
) |
|
Operating lease liabilities |
|
|
(387 |
) |
|
|
(75 |
) |
|
Long-term portion of accrued compensation, accrued pension liability
and accrued postretirement benefits |
|
|
420 |
|
|
|
63 |
|
|
Net cash used by operating activities |
|
|
(8,702 |
) |
|
|
(2,258 |
) |
|
Investing activities: |
|
|
|
|
|
|
|
|
|
Purchase of property, plant and equipment |
|
|
(1,227 |
) |
|
|
(797 |
) |
|
Proceeds from disposal of property, plant and equipment |
|
|
— |
|
|
|
6 |
|
|
Purchase of investments |
|
|
— |
|
|
|
(31,603 |
) |
|
Redemption of investments at maturity |
|
|
5,500 |
|
|
|
66,151 |
|
|
Acquisition of Barber-Nichols, LLC |
|
|
(59,563 |
) |
|
|
— |
|
|
Net cash (used) provided by investing activities |
|
|
(55,290 |
) |
|
|
33,757 |
|
|
Financing activities: |
|
|
|
|
|
|
|
|
|
Increase in short-term debt obligations |
|
|
4,000 |
|
|
|
— |
|
|
Principal repayments on long-term debt |
|
|
(500 |
) |
|
|
(4,599 |
) |
|
Proceeds from the issuance of long-term debt |
|
|
20,000 |
|
|
|
4,599 |
|
|
Principal repayments on finance lease obligations |
|
|
(10 |
) |
|
|
(24 |
) |
|
Repayments on lease financing obligations |
|
|
(91 |
) |
|
|
— |
|
|
Payment of debt issuance costs |
|
|
(150 |
) |
|
|
— |
|
|
Dividends paid |
|
|
(2,353 |
) |
|
|
(2,195 |
) |
|
Purchase of treasury stock |
|
|
(41 |
) |
|
|
(23 |
) |
|
Net cash provided (used) by financing activities |
|
|
20,855 |
|
|
|
(2,242 |
) |
|
Effect of exchange rate changes on cash |
|
|
68 |
|
|
|
144 |
|
|
Net (decrease) increase in cash and cash equivalents |
|
|
(43,069 |
) |
|
|
29,401 |
|
|
Cash and cash equivalents at beginning of period |
|
|
59,532 |
|
|
|
32,955 |
|
|
Cash and cash equivalents at end of period |
|
$ |
16,463 |
|
|
$ |
62,356 |
|
See Notes to Condensed Consolidated Financial Statements.
6
GRAHAM CORPORATION AND SUBSIDIARIES
CONDENSED CONSOLIDATED STATEMENTS OF CHANGES IN STOCKHOLDERS’ EQUITY
SIX MONTHS ENDED SEPTEMBER 30, 2021 AND 2020
(Dollar Amounts in Thousands)
(Unaudited)
|
|
|
Common Stock |
|
|
Capital in |
|
|
|
|
|
|
Accumulated
Other |
|
|
|
|
|
|
Total |
|
|
|
|
|
|
|
|
Par |
|
|
Excess of |
|
|
Retained |
|
|
Comprehensive |
|
|
Treasury |
|
|
Stockholders' |
|
|
|
|
Shares |
|
|
Value |
|
|
Par Value |
|
|
Earnings |
|
|
Loss |
|
|
Stock |
|
|
Equity |
|
|
Balance at April 1, 2021 |
|
|
10,748 |
|
|
$ |
1,075 |
|
|
$ |
27,272 |
|
|
$ |
89,372 |
|
|
$ |
(7,397 |
) |
|
$ |
(12,393 |
) |
|
$ |
97,929 |
|
|
Comprehensive loss |
|
|
|
|
|
|
|
|
|
|
|
|
|
|
(3,126 |
) |
|
|
298 |
|
|
|
|
|
|
|
(2,828 |
) |
|
Issuance of shares |
|
|
135 |
|
|
|
13 |
|
|
|
(13 |
) |
|
|
|
|
|
|
|
|
|
|
|
|
|
|
— |
|
|
Forfeiture of shares |
|
|
(9 |
) |
|
|
(1 |
) |
|
|
1 |
|
|
|
|
|
|
|
|
|
|
|
|
|
|
|
— |
|
|
Dividends |
|
|
|
|
|
|
|
|
|
|
|
|
|
|
(1,177 |
) |
|
|
|
|
|
|
|
|
|
|
(1,177 |
) |
|
Recognition of equity-based
compensation expense |
|
|
|
|
|
|
|
|
|
|
353 |
|
|
|
|
|
|
|
|
|
|
|
|
|
|
|
353 |
|
|
Issuance of treasury stock |
|
|
|
|
|
|
|
|
|
|
(194 |
) |
|
|
|
|
|
|
|
|
|
|
9,158 |
|
|
|
8,964 |
|
|
Purchase of treasury stock |
|
|
|
|
|
|
|
|
|
|
|
|
|
|
|
|
|
|
|
|
|
|
(41 |
) |
|
|
(41 |
) |
|
Balance at June 30, 2021 |
|
|
10,874 |
|
|
|
1,087 |
|
|
|
27,419 |
|
|
|
85,069 |
|
|
|
(7,099 |
) |
|
|
(3,276 |
) |
|
|
103,200 |
|
|
Comprehensive loss |
|
|
|
|
|
|
|
|
|
|
|
|
|
|
(492 |
) |
|
|
216 |
|
|
|
|
|
|
|
(276 |
) |
|
Issuance of shares |
|
|
27 |
|
|
|
3 |
|
|
|
(3 |
) |
|
|
|
|
|
|
|
|
|
|
|
|
|
|
— |
|
|
Forfeiture of shares |
|
|
(91 |
) |
|
|
(9 |
) |
|
|
9 |
|
|
|
|
|
|
|
|
|
|
|
|
|
|
|
|
|
|
Dividends |
|
|
|
|
|
|
|
|
|
|
|
|
|
|
(1,177 |
) |
|
|
|
|
|
|
|
|
|
|
(1,177 |
) |
|
Recognition of equity-based
compensation expense |
|
|
|
|
|
|
|
|
|
|
(23 |
) |
|
|
|
|
|
|
|
|
|
|
|
|
|
|
(23 |
) |
|
Issuance of treasury stock |
|
|
|
|
|
|
|
|
|
|
(63 |
) |
|
|
|
|
|
|
|
|
|
|
191 |
|
|
|
128 |
|
|
Balance at September 30, 2021 |
|
|
10,810 |
|
|
$ |
1,081 |
|
|
$ |
27,339 |
|
|
$ |
83,400 |
|
|
$ |
(6,883 |
) |
|
$ |
(3,085 |
) |
|
$ |
101,852 |
|
|
|
|
|
|
|
|
|
|
|
|
|
|
|
|
|
|
|
|
|
|
|
|
|
|
|
|
|
|
|
|
|
|
Common Stock |
|
|
Capital in |
|
|
|
|
|
|
Accumulated
Other |
|
|
|
|
|
|
Total |
|
|
|
|
|
|
|
|
Par |
|
|
Excess of |
|
|
Retained |
|
|
Comprehensive |
|
|
Treasury |
|
|
Stockholders' |
|
|
|
|
Shares |
|
|
Value |
|
|
Par Value |
|
|
Earnings |
|
|
Loss |
|
|
Stock |
|
|
Equity |
|
|
Balance at April 1, 2020 |
|
|
10,689 |
|
|
$ |
1,069 |
|
|
$ |
26,361 |
|
|
$ |
91,389 |
|
|
$ |
(9,556 |
) |
|
$ |
(12,539 |
) |
|
$ |
96,724 |
|
|
Comprehensive income |
|
|
|
|
|
|
|
|
|
|
|
|
|
|
(1,818 |
) |
|
|
214 |
|
|
|
|
|
|
|
(1,604 |
) |
|
Issuance of shares |
|
|
113 |
|
|
|
11 |
|
|
|
(11 |
) |
|
|
|
|
|
|
|
|
|
|
|
|
|
|
— |
|
|
Forfeiture of shares |
|
|
(22 |
) |
|
|
(2 |
) |
|
|
2 |
|
|
|
|
|
|
|
|
|
|
|
|
|
|
|
— |
|
|
Dividends |
|
|
|
|
|
|
|
|
|
|
|
|
|
|
(1,097 |
) |
|
|
|
|
|
|
|
|
|
|
(1,097 |
) |
|
Recognition of equity-based
compensation expense |
|
|
|
|
|
|
|
|
|
|
164 |
|
|
|
|
|
|
|
|
|
|
|
|
|
|
|
164 |
|
|
Purchase of treasury stock |
|
|
|
|
|
|
|
|
|
|
|
|
|
|
|
|
|
|
|
|
|
|
(23 |
) |
|
|
(23 |
) |
|
Balance at June 30, 2020 |
|
|
10,780 |
|
|
|
1,078 |
|
|
|
26,516 |
|
|
|
88,474 |
|
|
|
(9,342 |
) |
|
|
(12,562 |
) |
|
|
94,164 |
|
|
Comprehensive income |
|
|
|
|
|
|
|
|
|
|
|
|
|
|
2,744 |
|
|
|
350 |
|
|
|
|
|
|
|
3,094 |
|
|
Issuance of shares |
|
|
— |
|
|
|
|
|
|
|
— |
|
|
|
|
|
|
|
|
|
|
|
|
|
|
|
— |
|
|
Dividends |
|
|
|
|
|
|
|
|
|
|
|
|
|
|
(1,098 |
) |
|
|
|
|
|
|
|
|
|
|
(1,098 |
) |
|
Recognition of equity-based
compensation expense |
|
|
|
|
|
|
|
|
|
|
330 |
|
|
|
|
|
|
|
|
|
|
|
|
|
|
|
330 |
|
|
Issuance of treasury stock |
|
|
|
|
|
|
|
|
|
|
20 |
|
|
|
|
|
|
|
|
|
|
|
67 |
|
|
|
87 |
|
|
Balance at September 30, 2020 |
|
|
10,780 |
|
|
$ |
1,078 |
|
|
$ |
26,866 |
|
|
$ |
90,120 |
|
|
$ |
(8,992 |
) |
|
$ |
(12,495 |
) |
|
$ |
96,577 |
|
See Notes to Condensed Consolidated Financial Statements.
7
GRAHAM CORPORATION AND SUBSIDIARIES
NOTES TO CONDENSED CONSOLIDATED FINANCIAL STATEMENTS
(Unaudited)
(Amounts in thousands, except per share data)
NOTE 1 – BASIS OF PRESENTATION:
Graham Corporation's (the "Company's") Condensed Consolidated Financial Statements include its wholly-owned subsidiaries located in Suzhou, China and Ahmedabad, India at September 30, 2021 and March 31, 2021, and its recently acquired wholly-owned subsidiary, Barber-Nichols, LLC ("BN"), located in Arvada, Colorado at September 30, 2021 and for the period June 1, 2021 through September 30, 2021 (See Note 2). The Condensed Consolidated Financial Statements have been prepared in accordance with accounting principles generally accepted in the U.S. ("GAAP") for interim financial information and the instructions to Form 10-Q and Rule 8-03 of Regulation S-X, each as promulgated by the U.S. Securities and Exchange Commission. The Company's Condensed Consolidated Financial Statements do not include all information and notes required by GAAP for complete financial statements. The unaudited Condensed Consolidated Balance Sheet as of March 31, 2021 presented herein was derived from the Company’s audited Consolidated Balance Sheet as of March 31, 2021. For additional information, please refer to the consolidated financial statements and notes included in the Company's Annual Report on Form 10-K for the fiscal year ended March 31, 2021 ("fiscal 2021"). In the opinion of management, all adjustments, including normal recurring accruals considered necessary for a fair presentation, have been included in the Company's Condensed Consolidated Financial Statements.
The Company's results of operations and cash flows for the three and six months ended September 30, 2021 are not necessarily indicative of the results that may be expected for the current fiscal year, which ends March 31, 2022 ("fiscal 2022"). The three-month period (“quarter”) ended September 30, 2021 is also referred to as “the second quarter”.
NOTE 2 – ACQUISITION:
On June 1, 2021, the Company completed its acquisition of Barber-Nichols, LLC ("BN"), a privately-owned designer and manufacturer of turbomachinery products located in Arvada, Colorado that serves the defense and aerospace industry as well as the energy and cryogenic markets. The Company believes this acquisition furthers its growth strategy through market and product diversification, broadens its offerings and strengthens its presence in the defense industry, builds on its presence in the energy markets and adds capabilities in the space industry.
This transaction was accounted for as a business combination which requires that assets acquired and liabilities assumed be recognized at their fair value as of the acquisition date. The purchase price of $72,014 was comprised of 610 shares of the Company's common stock, representing a value of $8,964 at a price of $14.69 per share, and cash consideration of $61,150, subject to certain potential adjustments, including a customary working capital adjustment. The cash consideration was funded through cash on-hand and debt proceeds (See Note 15). The purchase agreement included a contingent earn-out dependent upon certain financial measures of BN post-acquisition, in which the sellers were eligible to receive up to $14,000 in additional cash consideration. At June 30, 2021, a liability of $1,900 was recorded for the contingent earn-out. Subsequent to the acquisition, the earn out agreement was terminated and the contingent liability was reversed into Other operating income, net, on the Company’s Condensed Statement of Operations. Prior to the acquisition, Barber Nichols, Inc. and Ascent Properties Group, LLC, a related party, entered into a nine year operating lease agreement for an office and manufacturing building in Arvada, Colorado. This lease was acquired as part of the transaction and has a monthly payment in the amount of $40 with a 3% yearly escalation. Acquisition related costs of $93 and $262 were expensed in the three and six month periods ending September 30, 2021, and are included in Selling, general and administrative expenses in the Condensed Consolidated Statement of Operations.
The cost of the acquisition was preliminarily allocated to the assets acquired and liabilities assumed based upon its estimated fair values at the date of the acquisition and the amount exceeding the fair value of $22,923 was recorded as goodwill, which is not deductible for tax purposes. During the second quarter, the preliminary valuation of backlog was increased by $100, therefore goodwill was reduced to $22,823. As the values of certain assets and liabilities are preliminary in nature, they are subject to adjustment as additional information is obtained, including, but not limited to, the finalization of the valuation of intangible assets, the final reconciliation and confirmation of tangible assets. The valuation of acquisition-related intangible assets will be finalized within twelve months of the close of the acquisition. The fair value of acquisition-related intangible assets includes customer relationships, technology and technical know-how, backlog and trade name. Backlog and trade name are included in the line item "Other intangible assets, net" in the Condensed Consolidated Balance Sheet. Customer relationships were valued using an income approach, specifically the Multi Period Excess Earnings method, which incorporates assumptions regarding retention rate, new customer growth and customer related costs. Trade name and technology and technical know-how were both valued using a Relief from Royalty method, which develops a market based royalty rate used to reflect the after tax royalty savings attributable to owning the intangible asset. The fair value of backlog was determined using a net realizable value methodology, and was computed as the present value of
8
the expected sales attributable to backlog less the remaining costs to fulfill the backlog. Changes to the preliminary valuation may result in material adjustments to the fair value of assets and liabilities acquired.
The purchase price was allocated to specific intangible assets on a preliminary basis as follows:
|
|
|
Fair Value Assigned |
|
|
Weighted Average Amortization Period |
|
At September 30, 2021 |
|
|
|
|
|
|
|
Intangibles subject to amortization: |
|
|
|
|
|
|
|
Customer relationships |
|
$ |
11,800 |
|
|
20 years |
|
Technology and technical know how |
|
|
10,100 |
|
|
20 years |
|
Backlog |
|
|
3,900 |
|
|
4 years |
|
|
|
$ |
25,800 |
|
|
|
|
Intangibles not subject to amortization: |
|
|
|
|
|
|
|
Tradename |
|
|
7,400 |
|
|
Indefinite |
|
|
|
$ |
7,400 |
|
|
|
Technology and technical know-how and customer relationships are amortized in selling, general and administrative expense on a straight line basis over their estimated useful lives. Backlog is amortized in cost of products sold over the projected conversion period based on management estimates at time of purchase. Intangible amortization was $784 and $1,009 for the three and six months ended September 30, 2021. The estimated annual amortization expense is as follows:
|
|
|
Annual Amortization |
|
|
Remainder of 2022 |
|
$ |
1,497 |
|
|
2023 |
|
|
2,462 |
|
|
2024 |
|
|
1,775 |
|
|
2025 |
|
|
1,327 |
|
|
2026 |
|
|
1,123 |
|
|
2027 and thereafter |
|
|
16,607 |
|
|
Total intangible amortization |
|
$ |
24,791 |
|
|
|
|
|
|
|
9
The following table summarizes the preliminary allocation of the cost of the acquisition to the assets acquired and liabilities assumed as of the close of the acquisition:
|
|
|
June 1, |
|
|
|
|
2021 |
|
|
Assets acquired: |
|
|
|
|
|
Cash and cash equivalents |
|
$ |
1,587 |
|
|
Accounts receivable |
|
|
8,154 |
|
|
Unbilled revenue |
|
|
7,068 |
|
|
Inventory |
|
|
3,669 |
|
|
Other current assets |
|
|
409 |
|
|
Property, plant & equipment |
|
|
8,037 |
|
|
Operating lease asset |
|
|
9,026 |
|
|
Goodwill |
|
|
22,823 |
|
|
Backlog |
|
|
3,900 |
|
|
Customer relationships |
|
|
11,800 |
|
|
Technology and technical know how |
|
|
10,100 |
|
|
Tradename |
|
|
7,400 |
|
|
Total assets acquired |
|
|
93,973 |
|
|
Liabilities assumed: |
|
|
|
|
|
Accounts payable |
|
|
2,736 |
|
|
Accrued compensation |
|
|
1,341 |
|
|
Other current liabilities |
|
|
665 |
|
|
Customer deposits |
|
|
6,048 |
|
|
Operating lease liabilities |
|
|
9,066 |
|
|
Other long term liabilities |
|
|
2,103 |
|
|
Total liabilities assumed |
|
|
21,959 |
|
|
Purchase price |
|
$ |
72,014 |
|
The Condensed Consolidated Statement of Operations for the three and six months ended September 30, 2021 includes net sales of BN of $16,486 and $19,957, respectively. The following unaudited pro forma information presents the consolidated results of operations of the Company as if the BN acquisition had occurred at the beginning of each of the fiscal periods presented:
|
|
|
Three Months Ended |
|
|
Six Months Ended |
|
|
|
|
September 30, |
|
|
September 30, |
|
|
|
|
2021 |
|
|
2020 |
|
|
2021 |
|
|
2020 |
|
|
Net sales |
|
$ |
34,146 |
|
|
$ |
44,174 |
|
|
$ |
69,779 |
|
|
$ |
76,360 |
|
|
Net (loss) income |
|
|
(231 |
) |
|
|
4,374 |
|
|
|
(2,256 |
) |
|
|
5,149 |
|
|
(Loss) earnings per share |
|
|
|
|
|
|
|
|
|
|
|
|
|
|
|
|
|
Basic |
|
$ |
(0.02 |
) |
|
$ |
0.41 |
|
|
$ |
(0.21 |
) |
|
$ |
0.49 |
|
|
Diluted |
|
$ |
(0.02 |
) |
|
$ |
0.41 |
|
|
$ |
(0.21 |
) |
|
$ |
0.49 |
|
The unaudited pro forma information presents the combined operating results of Graham Corporation and BN, with the results prior to the acquisition date adjusted to include the pro forma impact of the adjustment of depreciation of fixed assets based on the preliminary purchase price allocation, the adjustment to interest income reflecting the cash paid in connection with the acquisition, including acquisition-related expenses, at the Company’s weighted average interest income rate, interest expense and loan origination fees at the Company’s current interest rate, amortization expense related to the fair value adjustments for intangible assets, non-recurring acquisition-related costs and the impact of income taxes on the pro forma adjustments utilizing the applicable statutory tax rate.
The unaudited pro forma results are presented for illustrative purposes only. These pro forma results do not purport to be indicative of the results that would have actually been obtained if the acquisition occurred as of the beginning of each of the periods presented, nor does the pro forma data intend to be a projection of results that may be obtained in the future.
10
NOTE 3 – REVENUE RECOGNITION:
The Company recognizes revenue on contracts when or as it satisfies a performance obligation by transferring control of the product to the customer. For contracts in which revenue is recognized upon shipment, control is generally transferred when products are shipped, title is transferred, significant risks of ownership have transferred, the Company has rights to payment, and rewards of ownership pass to the customer. For contracts in which revenue is recognized over time, control is generally transferred as the Company creates an asset that does not have an alternative use to the Company and the Company has an enforceable right to payment for the performance completed to date.
The following table presents the Company’s revenue disaggregated by product line and geographic area:
|
|
|
Three Months Ended |
|
|
Six Months Ended |
|
|
|
|
September 30, |
|
|
September 30, |
|
|
Product Line |
|
2021 |
|
|
2020 |
|
|
2021 |
|
|
2020 |
|
|
Heat transfer equipment |
|
$ |
8,706 |
|
|
$ |
13,307 |
|
|
$ |
15,470 |
|
|
$ |
23,980 |
|
|
Vacuum equipment |
|
|
4,315 |
|
|
|
9,381 |
|
|
|
8,534 |
|
|
|
11,932 |
|
|
Fluid systems |
|
|
6,595 |
|
|
|
— |
|
|
|
8,403 |
|
|
|
— |
|
|
Power systems |
|
|
9,890 |
|
|
|
— |
|
|
|
11,553 |
|
|
|
— |
|
|
All other |
|
|
4,640 |
|
|
|
5,266 |
|
|
|
10,343 |
|
|
|
8,752 |
|
|
Net sales |
|
$ |
34,146 |
|
|
$ |
27,954 |
|
|
$ |
54,303 |
|
|
$ |
44,664 |
|
|
|
|
|
|
|
|
|
|
|
|
|
|
|
|
|
|
|
|
|
|
|
|
|
|
|
|
|
|
|
|
|
|
|
|
|
|
Geographic Region |
|
|
|
|
|
|
|
|
|
|
|
|
|
|
|
|
|
Asia |
|
$ |
5,483 |
|
|
$ |
4,529 |
|
|
$ |
8,992 |
|
|
$ |
9,692 |
|
|
Canada |
|
|
879 |
|
|
|
1,938 |
|
|
|
2,087 |
|
|
|
2,930 |
|
|
Middle East |
|
|
963 |
|
|
|
988 |
|
|
|
1,575 |
|
|
|
1,437 |
|
|
South America |
|
|
236 |
|
|
|
2,592 |
|
|
|
478 |
|
|
|
2,812 |
|
|
U.S. |
|
|
26,201 |
|
|
|
17,252 |
|
|
|
40,095 |
|
|
|
26,690 |
|
|
All other |
|
|
384 |
|
|
|
655 |
|
|
|
1,076 |
|
|
|
1,103 |
|
|
Net sales |
|
$ |
34,146 |
|
|
$ |
27,954 |
|
|
$ |
54,303 |
|
|
$ |
44,664 |
|
A performance obligation represents a promise in a contract to provide a distinct good or service to a customer. The Company accounts for a contract when it has approval and commitment from both parties, the rights of the parties are identified, payment terms are identified, the contract has commercial substance and collectability of consideration is probable. Transaction price reflects the amount of consideration to which the Company expects to be entitled in exchange for transferred products. A contract’s transaction price is allocated to each distinct performance obligation and revenue is recognized as the performance obligation is satisfied. In certain cases, the Company may separate a contract into more than one performance obligation, while in other cases, several products may be part of a fully integrated solution and are bundled into a single performance obligation. If a contract is separated into more than one performance obligation, the Company allocates the total transaction price to each performance obligation in an amount based on the estimated relative standalone selling prices of the promised goods underlying each performance obligation. The Company has made an accounting policy election to exclude from the measurement of the contract price all taxes assessed by government authorities that are collected by the Company from its customers. The Company does not adjust the contract price for the effects of a financing component if the Company expects, at contract inception, that the period between when a product is transferred to a customer and when the customer pays for the product will be one year or less. Shipping and handling fees billed to the customer are recorded in revenue and the related costs incurred for shipping and handling are included in cost of products sold.
Revenue on the majority of the Company’s contracts, as measured by number of contracts, is recognized upon shipment to the customer. Revenue on larger contracts, which are fewer in number but represent the majority of revenue, is recognized over time. Revenue from contracts that is recognized upon shipment accounted for approximately 20% and 40% of revenue for the three-month periods ended September 30, 2021 and 2020, respectively, and revenue from contracts that is recognized over time accounted for approximately 80% and 60% of revenue for the three-month periods ended September 30, 2021 and 2020, respectively. Revenue from contracts that is recognized upon shipment accounted for approximately 25% and 50% of revenue for the six-month periods ended September 30, 2021 and 2020, respectively, and revenue from contracts that is recognized over time accounted for approximately 75% and 50% of revenue for the six-month periods ended September 30, 2021 and 2020, respectively. The Company recognizes revenue over time when contract performance results in the creation of a product for which the Company does not have an alternative use and the contract includes an enforceable right to payment in an amount that corresponds directly with the value of the performance completed. To measure progress towards completion on performance obligations for which revenue is recognized over time the Company utilizes an input method based upon a ratio of direct labor hours incurred to date to management’s estimate of the total labor
11
hours to be incurred on each contract, an input method based upon a ratio of total contract costs incurred to date to management’s estimate of the total contract costs to be incurred or an output method based upon completion of operational milestones, depending upon the nature of the contract. The Company has established the systems and procedures essential to developing the estimates required to account for performance obligations over time. These procedures include monthly review by management of costs incurred, progress towards completion, identified risks and opportunities, sourcing determinations, changes in estimates of costs yet to be incurred, availability of materials, and execution by subcontractors. Sales and earnings are adjusted in current accounting periods based on revisions in the contract value due to pricing changes and estimated costs at completion. Losses on contracts are recognized immediately when evident to management.
The timing of revenue recognition, invoicing and cash collections affect trade accounts receivable, unbilled revenue (contract assets) and customer deposits (contract liabilities) on the Condensed Consolidated Balance Sheets. Unbilled revenue represents revenue on contracts that is recognized over time and exceeds the amount that has been billed to the customer. Unbilled revenue is separately presented in the Condensed Consolidated Balance Sheets. The Company may have an unconditional right to payment upon billing and prior to satisfying the performance obligations. The Company will then record a contract liability and an offsetting asset of equal amount until the deposit is collected and the performance obligations are satisfied. Customer deposits are separately presented in the Condensed Consolidated Balance Sheets. Customer deposits are not considered a significant financing component as they are generally received less than one year before the product is completed or used to procure specific material on a contract, as well as related overhead costs incurred during design and construction.
Net contract assets (liabilities) consisted of the following:
|
|
|
September 30, 2021 |
|
|
March 31, 2021 |
|
|
Change |
|
|
|
|
|
|
|
|
|
|
|
|
|
|
|
|
Unbilled revenue (contract assets) |
|
$ |
29,035 |
|
|
$ |
19,994 |
|
|
$ |
9,041 |
|
|
Customer deposits (contract liabilities) |
|
|
(21,941 |
) |
|
|
(14,059 |
) |
|
|
(7,882 |
) |
|
Net contract liabilities |
|
$ |
7,094 |
|
|
$ |
5,935 |
|
|
$ |
1,159 |
|
Contract liabilities at September 30, and March 31, 2021 include $2,902 and $1,603, respectively, of customer deposits for which the Company has an unconditional right to collect payment. Trade accounts receivable, as presented on the Condensed Consolidated Balance Sheets, includes corresponding balances at September 30, and March 31, 2021, respectively. Revenue recognized in the three and six months ended September 30, 2021 that was included in the contract liability balance at March 31, 2021 was $13,293. Changes in the net contract liability balance during the six months ended September 30, 2020 were impacted by a $9,041 increase in contract assets, of which $19,828 was due to contract progress and the acquisition of BN’s contract assets of $7,068 offset by invoicing to customers of $17,855. In addition, contract liabilities increased $7,882 driven by revenue recognized in the current period that was included in the contract liability balance at March 31, 2021 offset by new customer deposits of $15,127 and the acquisition of BN’s contract liabilities of $6,048.
Receivables billed but not paid under retainage provisions in the Company’s customer contracts were $3,364 and $3,747 at September 30, and March 31, 2021, respectively.
Incremental costs to obtain a contract consist of sales employee and agent commissions. Commissions paid to employees and sales agents are capitalized when paid and amortized to selling, general and administrative expense when the related revenue is recognized. Capitalized costs, net of amortization, to obtain a contract were $79 and $39 at September 30, and March 31, 2021, respectively, and are included in the line item "Prepaid expenses and other current assets" in the Condensed Consolidated Balance Sheets. The related amortization expense was $24 and $89 in the three months ended September 30, 2021 and 2020, respectively, and $34 and $251 in the six months ended September 30, 2021 and 2020
The Company’s remaining unsatisfied performance obligations represent a measure of the total dollar value of work to be performed on contracts awarded and in progress. The Company also refers to this measure as backlog. As of September 30, 2021, the Company had remaining unsatisfied performance obligations of $233,247. The Company expects to recognize revenue on approximately 45% to 50% of the remaining performance obligations within one year, 25% to 35% in one to two years and the remaining beyond two years.
NOTE 4 – INVESTMENTS:
No investments were held by the Company at September 30, 2021. Investments, if any, consist of certificates of deposits with financial institutions. All investments have original maturities of greater than three months and less than one year and are classified as
12
held-to-maturity, as the Company believes it has the intent and ability to hold the securities to maturity. Investments are stated at amortized cost which approximates fair value.
NOTE 5 – INVENTORIES:
Inventories are stated at the lower of cost or net realizable value, using the average cost method.
Major classifications of inventories are as follows:
|
|
|
September 30, |
|
|
March 31, |
|
|
|
|
2021 |
|
|
2021 |
|
|
Raw materials and supplies |
|
$ |
4,156 |
|
|
$ |
3,490 |
|
|
Work in process |
|
|
11,454 |
|
|
|
12,196 |
|
|
Finished products |
|
|
2,112 |
|
|
|
1,646 |
|
|
Total |
|
$ |
17,722 |
|
|
$ |
17,332 |
|
NOTE 6 – EQUITY-BASED COMPENSATION:
The 2020 Graham Corporation Equity Incentive Plan (the (the "2020 Plan"), as approved by the Company’s stockholders at the Annual Meeting on August 11, 2020, provides for the issuance of 422 shares of common stock in connection with grants of incentive stock options, non-qualified stock options, restricted stock units and stock awards to officers, key employees and outside directors. The shares available for issuance include 112 remaining available shares under the Company’s prior plan, the Amended and Restated 2000 Graham Corporation Incentive Plan to Increase Shareholder Value (the"2000 Plan"). As of August 11, 2020, the effective date of the 2020 Plan, no further awards will be granted under the 2000 Plan. However, 33 stock options and 53 shares of unvested restricted stock under the 2000 Plan remains subject to the terms of such plan until the time it is no longer outstanding.
Restricted stock awards of 27 were granted in the three-month period ended September 30, 2021, 18 shares of which vest 100% on the third anniversary of the grant date subject to the satisfaction of the performance metrics for the applicable three-year period and 9 shares that vest 33⅓% per year over a three-year term. Restricted stock awards granted in the six-month periods ended September 30, 2021 and 2020 were 162 and 113, respectively. Restricted shares of 88 and 54 granted to officers in fiscal 2022 and fiscal 2021, respectively, vest 100% on the third anniversary of the grant date subject to the satisfaction of the performance metrics for the applicable three-year period. Restricted shares of 54 and 38 granted to officers and key employees in fiscal 2022 and fiscal 2021, respectively, vest 33⅓% per year over a three-year term. Restricted shares of 20 and 21 granted to directors in fiscal 2022 and fiscal 2021, respectively, vest 100% on the first year anniversary of the grant date. No stock option awards were granted in the three-month or six-month periods ended September 30, 2021 and 2020.
During the three months ended September 30, 2021 and 2020, the Company recognized equity-based compensation costs related to restricted stock awards of ($22) and $316, respectively. The income tax benefit recognized related to equity-based compensation was ($6) and $73 for the three months ended September 30, 2021 and 2020, respectively. During the six months ended September 30, 2021 and 2020, the Company recognized equity-based compensation costs related to restricted stock awards of $315 and $471, respectively. The income tax benefit recognized related to equity-based compensation was $69 and $111 for the six months ended September 30, 2021 and 2020, respectively.
The Company has an Employee Stock Purchase Plan (the "ESPP"), which allows eligible employees to purchase shares of the Company's common stock at a discount of up to 15% of its fair market value on the (1) last, (2) first or (3) lower of the last or first day of the six-month offering period. A total of 200 shares of common stock may be purchased under the ESPP. During the three months ended September 30, 2021 and 2020, the Company recognized equity-based compensation costs of $(1) and $14, respectively, related to the ESPP and $0 and $3, respectively, of related tax benefits. During the six-months ended September 30, 2021 and 2020, the Company recognized equity-based compensation costs of $15 and $23, respectively, related to the ESPP and $4 and $5, respectively, of related tax benefits.
NOTE 7 – (LOSS) INCOME PER SHARE:
Basic (loss) income per share is computed by dividing net (loss) income by the weighted average number of common shares outstanding for the period. Diluted (loss) income per share is calculated by dividing net (loss) income by the weighted average number
13
of common shares outstanding and, when applicable, potential common shares outstanding during the period. A reconciliation of the numerators and denominators of basic and diluted (loss) income per share is presented below:
|
|
|
Three Months Ended |
|
|
Six Months Ended |
|
|
|
|
September 30, |
|
|
September 30, |
|
|
|
|
2021 |
|
|
2020 |
|
|
2021 |
|
|
2020 |
|
|
Basic (loss) income per share |
|
|
|
|
|
|
|
|
|
|
|
|
|
|
|
|
|
Numerator: |
|
|
|
|
|
|
|
|
|
|
|
|
|
|
|
|
|
Net (loss) income |
|
$ |
(492 |
) |
|
$ |
2,744 |
|
|
$ |
(3,618 |
) |
|
$ |
926 |
|
|
Denominator: |
|
|
|
|
|
|
|
|
|
|
|
|
|
|
|
|
|
Weighted average common shares
outstanding |
|
|
10,681 |
|
|
|
9,977 |
|
|
|
10,442 |
|
|
|
9,936 |
|
|
Basic (loss) income per share |
|
$ |
(0.05 |
) |
|
$ |
0.27 |
|
|
$ |
(0.35 |
) |
|
$ |
0.09 |
|
|
|
|
|
|
|
|
|
|
|
|
|
|
|
|
|
|
|
|
Diluted (loss) income per share |
|
|
|
|
|
|
|
|
|
|
|
|
|
|
|
|
|
Numerator: |
|
|
|
|
|
|
|
|
|
|
|
|
|
|
|
|
|
Net (loss) income |
|
$ |
(492 |
) |
|
$ |
2,744 |
|
|
$ |
(3,618 |
) |
|
$ |
926 |
|
|
Denominator: |
|
|
|
|
|
|
|
|
|
|
|
|
|
|
|
|
|
Weighted average common shares
outstanding |
|
|
10,681 |
|
|
|
9,977 |
|
|
|
10,442 |
|
|
|
9,936 |
|
|
Stock options outstanding |
|
|
— |
|
|
|
— |
|
|
|
— |
|
|
|
— |
|
|
Weighted average common and
potential common shares
outstanding |
|
|
10,681 |
|
|
|
9,977 |
|
|
|
10,442 |
|
|
|
9,936 |
|
|
Diluted loss per share |
|
$ |
(0.05 |
) |
|
$ |
0.27 |
|
|
$ |
(0.35 |
) |
|
$ |
0.09 |
|
None of the options to purchase 33 shares of common stock at September 30, 2021 were included in the computation of diluted income per share as the affect would be anti-dilutive due to the net losses in the quarters. None of the options to purchase 37 shares of common stock at September 30, 2020 were included in the above computation of diluted income per share given their exercise prices as they would not be dilutive upon issuance.
NOTE 8 – PRODUCT WARRANTY LIABILITY:
The reconciliation of the changes in the product warranty liability is as follows:
|
|
|
Three Months Ended |
|
|
Six Months Ended |
|
|
|
|
September 30, |
|
|
September 30, |
|
|
|
|
2021 |
|
|
2020 |
|
|
2021 |
|
|
2020 |
|
|
Balance at beginning of period |
|
$ |
522 |
|
|
$ |
305 |
|
|
$ |
626 |
|
|
$ |
359 |
|
|
BNI warranty accrual acquired |
|
|
— |
|
|
|
— |
|
|
|
169 |
|
|
|
— |
|
|
(Income) expense for product warranties |
|
|
(5 |
) |
|
|
14 |
|
|
|
(21 |
) |
|
|
(5 |
) |
|
Product warranty claims paid |
|
|
(68 |
) |
|
|
(11 |
) |
|
|
(325 |
) |
|
|
(46 |
) |
|
Balance at end of period |
|
$ |
449 |
|
|
$ |
308 |
|
|
$ |
449 |
|
|
$ |
308 |
|
Income of $5 for product warranties in the three months ended September30, 2021 and income of $21 and $5 for product warranties in the six months ended September 30, 2021 and 2020, respectively, resulted from the reversal of provisions made that were no longer required due to lower claims experience.
The product warranty liability is included in the line item "Accrued expenses and other current liabilities" in the Condensed Consolidated Balance Sheets.
NOTE 9 – CASH FLOW STATEMENT:
Interest paid was $135 and $8 in the six-month periods ended September 30, 2021 and 2020, respectively. Income taxes paid (refunded) for the six months ended September 30, 2021 and 2020 were $1,318 and $(93), respectively.
At September 30, 2021 and 2020, there were $39 and $86, respectively, of capital purchases that were recorded in accounts payable and are not included in the caption "Purchase of property, plant and equipment" in the Condensed Consolidated Statements of Cash Flows.
14
The cash utilized for the acquisition of BN of $59,563 included the cash consideration of $61,150, net of cash acquired of $1,587. In the six months ended September 30, 2021, non-cash activities included the issuance of 610 treasury shares valued at $8,964, included as part of the consideration for the acquisition of BN.
In the second quarter, non-cash activities included pension adjustments, net of income tax, of $68.
NOTE 10 – EMPLOYEE BENEFIT PLANS:
The components of pension cost are as follows:
|
|
|
Three Months Ended |
|
|
Six Months Ended |
|
|
|
|
September 30, |
|
|
September 30, |
|
|
|
|
2021 |
|
|
2020 |
|
|
2021 |
|
|
2020 |
|
|
Service cost |
|
$ |
94 |
|
|
$ |
115 |
|
|
$ |
187 |
|
|
$ |
231 |
|
|
Interest cost |
|
|
298 |
|
|
|
303 |
|
|
|
598 |
|
|
|
606 |
|
|
Expected return on assets |
|
|
(682 |
) |
|
|
(628 |
) |
|
|
(1,364 |
) |
|
|
(1,257 |
) |
|
Amortization of actuarial loss |
|
|
229 |
|
|
|
260 |
|
|
|
442 |
|
|
|
520 |
|
|
Net pension cost |
|
$ |
(61 |
) |
|
$ |
50 |
|
|
$ |
(137 |
) |
|
$ |
100 |
|
The Company made no contributions to its defined benefit pension plan during the six months ended September 30, 2021 and does not expect to make any contributions to the plan for the balance of fiscal 2022.
During the second quarter ended September 30, 2021, the Company remeasured the projected benefit obligation to the supplemental executive retirement plan due to the retirement of the Company’s chief executive officer, who was the only active participant in the plan. Recognition of an actuarial gain, net of tax, of $68 was included in other comprehensive (loss) income.
The components of the postretirement benefit cost are as follows:
|
|
|
Three Months Ended |
|
|
Six Months Ended |
|
|
|
|
September 30, |
|
|
September 30, |
|
|
|
|
2021 |
|
|
2020 |
|
|
2021 |
|
|
2020 |
|
|
Interest cost |
|
$ |
4 |
|
|
$ |
4 |
|
|
$ |
7 |
|
|
$ |
9 |
|
|
Amortization of actuarial loss |
|
|
6 |
|
|
|
7 |
|
|
|
12 |
|
|
|
13 |
|
|
Net postretirement benefit cost |
|
$ |
10 |
|
|
$ |
11 |
|
|
$ |
19 |
|
|
$ |
22 |
|
The Company paid no benefits related to its postretirement benefit plan during the six months ended September 30, 2021. The Company expects to pay benefits of approximately $72 for the balance of fiscal 2022.
The components of net periodic benefit cost other than service cost are included in the line item "Other income" in the Condensed Consolidated Statements of Operations.
The Company self-funds the medical insurance coverage it provides to its U.S. based employees in certain locations. The Company maintains a stop loss insurance policy in order to limit its exposure to claims. The liability of $164 and $184 on September 30, 2021 and March 31, 2021, respectively, related to the self-insured medical plan is primarily based upon claim history and is included in the caption "Accrued compensation" as a current liability in the Condensed Consolidated Balance Sheets.
NOTE 11 – COMMITMENTS AND CONTINGENCIES:
The Company has been named as a defendant in lawsuits alleging personal injury from exposure to asbestos allegedly contained in, or accompanying, products made by the Company. The Company is a co-defendant with numerous other defendants in these lawsuits and intends to vigorously defend itself against these claims. The claims in the Company’s current lawsuits are similar to those made in previous asbestos-related suits that named the Company as a defendant, which either were dismissed when it was shown that the Company had not supplied products to the plaintiffs’ places of work or were settled for immaterial amounts. The Company cannot provide any assurances that any pending or future matters will be resolved in the same manner as previous lawsuits.
As of September 30, 2021, the Company was subject to the claims noted above, as well as other legal proceedings and potential claims that have arisen in the ordinary course of business.
15
Although the outcome of the lawsuits, legal proceedings or potential claims to which the Company is, or may become, a party to cannot be determined and an estimate of the reasonably possible loss or range of loss cannot be made for the majority of the claims, management does not believe that the outcomes, either individually or in the aggregate, will have a material adverse effect on the Company’s results of operations, financial position or cash flows.
NOTE 12 – INCOME TAXES:
The Company files federal and state income tax returns in several domestic and international jurisdictions. In most tax jurisdictions, returns are subject to examination by the relevant tax authorities for a number of years after the returns have been filed. The Company is subject to U.S. federal examination for the tax years 2017 through 2020 and examination in state tax jurisdictions for the tax years 2016 through 2020. The Company is subject to examination in the People’s Republic of China for tax years 2017 through 2020 and in India for tax year 2019 through 2020.
There was no liability for unrecognized tax benefits at either September 30, 2021 or March 31, 2021.
NOTE 13 – CHANGES IN ACCUMULATED OTHER COMPREHENSIVE LOSS:
The changes in accumulated other comprehensive loss by component for the six months ended September 30, 2021 and 2020 are as follows:
|
|
|
Pension and
Other
Postretirement
Benefit Items |
|
|
Foreign
Currency
Items |
|
|
Total |
|
|
Balance at April 1, 2021 |
|
$ |
(7,698 |
) |
|
$ |
301 |
|
|
$ |
(7,397 |
) |
|
Other comprehensive income before reclassifications |
|
|
68 |
|
|
|
93 |
|
|
|
161 |
|
|
Amounts reclassified from accumulated other comprehensive
loss |
|
|
353 |
|
|
|
— |
|
|
|
353 |
|
|
Net current-period other comprehensive income |
|
|
421 |
|
|
|
93 |
|
|
|
514 |
|
|
Balance at September 30, 2021 |
|
$ |
(7,277 |
) |
|
$ |
394 |
|
|
$ |
(6,883 |
) |
|
|
|
Pension and
Other
Postretirement
Benefit Items |
|
|
Foreign
Currency
Items |
|
|
Total |
|
|
Balance at April 1, 2020 |
|
$ |
(9,472 |
) |
|
$ |
(84 |
) |
|
$ |
(9,556 |
) |
|
Other comprehensive loss before reclassifications |
|
|
— |
|
|
|
155 |
|
|
|
155 |
|
|
Amounts reclassified from accumulated other comprehensive
loss |
|
|
409 |
|
|
|
— |
|
|
|
409 |
|
|
Net current-period other comprehensive income (loss) |
|
|
409 |
|
|
|
155 |
|
|
|
564 |
|
|
Balance at September 30, 2020 |
|
$ |
(9,063 |
) |
|
$ |
71 |
|
|
$ |
(8,992 |
) |
The reclassifications out of accumulated other comprehensive loss by component for the three and six months ended September 30, 2021 and 2020 are as follows:
|
Details about Accumulated Other
Comprehensive Loss Components |
|
Amount Reclassified from
Accumulated Other
Comprehensive Loss |
|
|
|
Affected Line Item in the Condensed
Consolidated Statements of Income |
|
|
|
Three Months Ended |
|
|
|
|
|
|
|
September 30, |
|
|
|
|
|
|
|
2021 |
|
|
|
2020 |
|
|
|
|
|
Pension and other postretirement benefit items: |
|
|
|
|
|
|
|
|
|
|
|
|
|
Amortization of actuarial loss |
|
$ |
(236 |
) |
(1) |
|
$ |
(267 |
) |
(1) |
|
Loss before benefit for income taxes |
|
|
|
|
(53 |
) |
|
|
|
(63 |
) |
|
|
Benefit for income taxes |
|
|
|
$ |
(183 |
) |
|
|
$ |
(204 |
) |
|
|
Net loss |
16
|
Details about Accumulated Other
Comprehensive Loss Components |
|
Amount Reclassified from
Accumulated Other
Comprehensive Loss |
|
|
|
Affected Line Item in the Condensed
Consolidated Statements of Income |
|
|
|
Six Months Ended |
|
|
|
|
|
|
|
September 30, |
|
|
|
|
|
|
|
2021 |
|
|
|
2020 |
|
|
|
|
|
Pension and other postretirement benefit items: |
|
|
|
|
|
|
|
|
|
|
|
|
|
Amortization of actuarial loss |
|
$ |
(455 |
) |
(1) |
|
$ |
(533 |
) |
(1) |
|
Loss before benefit for income taxes |
|
|
|
|
(102 |
) |
|
|
|
(124 |
) |
|
|
Benefit for income taxes |
|
|
|
$ |
(353 |
) |
|
|
$ |
(409 |
) |
|
|
Net loss |
|
(1) |
These accumulated other comprehensive loss components are included within the computation of pension and other postretirement benefit costs. See Note 10. |
NOTE 14 – LEASES:
The Company leases certain manufacturing facilities, office space, machinery and office equipment. An arrangement is considered to contain a lease if it conveys the right to use and control an identified asset for a period of time in exchange for consideration. If it is determined that an arrangement contains a lease, then a classification of a lease as operating or finance is determined by evaluating the five criteria outlined in the lease accounting guidance at inception. Leases generally have remaining terms of one year to five years, whereas leases with an initial term of twelve months or less are not recorded on the Condensed Consolidated Balance Sheets. The depreciable life of leased assets related to finance leases is limited by the expected term of the lease, unless there is a transfer of title or purchase option that the Company believes is reasonably certain of exercise. Certain leases include options to renew or terminate. Renewal options are exercisable per the discretion of the Company and vary based on the nature of each lease. The term of the lease includes renewal periods only if the Company is reasonably certain that it will exercise the renewal option. When determining if a renewal option is reasonably certain of being exercised, the Company considers several factors, including but not limited to, the cost of moving to another location, the cost of disrupting operations, whether the purpose or location of the leased asset is unique and the contractual terms associated with extending the lease. The Company’s lease agreements do not contain any residual value guarantees or any material restrictive covenants and the Company does not sublease to any third parties. As of September 30, 2021, the Company did not have any material leases that have been signed but not commenced.
Right-of-use (“ROU”) lease assets and lease liabilities are recognized based on the present value of the future minimum lease payments over the lease term at commencement date. ROU assets represent the Company’s right to use an underlying asset for the lease term and lease liabilities represent the Company’s obligation to make payments in exchange for that right of use. Finance lease ROU assets and operating lease ROU assets are included in the line items “Property, plant and equipment, net” and “Operating lease assets”, respectively, in the Condensed Consolidated Balance Sheets. The current portion and non-current portion of finance and operating lease liabilities are all presented separately in the Condensed Consolidated Balance Sheets.
The discount rate implicit within the Company’s leases is generally not readily determinable, and therefore, the Company uses an incremental borrowing rate in determining the present value of lease payments based on rates available at commencement.
The weighted average remaining lease term and discount rate for finance and operating leases are as follows:
|
|
|
September 30, |
|
|
September 30, |
|
|
|
|
2021 |
|
|
2020 |
|
|
Finance Leases |
|
|
|
|
|
|
|
|
|
Weighted-average remaining lease term in years |
|
|
1.91 |
|
|
|
2.69 |
|
|
Weighted-average discount rate |
|
|
10.72 |
% |
|
|
10.45 |
% |
|
|
|
|
|
|
|
|
|
|
|
Operating Leases |
|
|
|
|
|
|
|
|
|
Weighted-average remaining lease term in years |
|
|
7.91 |
|
|
|
1.69 |
|
|
Weighted-average discount rate |
|
|
3.26 |
% |
|
|
5.49 |
% |
17
The components of lease expense are as follows:
|
|
|
Three Months Ended |
|
|
Six Months Ended |
|
|
|
|
September 30, |
|
|
September 30, |
|
|
|
|
2021 |
|
|
2020 |
|
|
2021 |
|
|
2020 |
|
|
Finance lease cost: |
|
|
|
|
|
|
|
|
|
|
|
|
|
|
|
|
|
Amortization of right-of-use assets |
|
$ |
5 |
|
|
$ |
5 |
|
|
$ |
10 |
|
|
$ |
10 |
|
|
Interest on lease liabilities |
|
|
2 |
|
|
|
2 |
|
|
|
3 |
|
|
|
4 |
|
|
Operating lease cost |
|
|
384 |
|
|
|
41 |
|
|
|
540 |
|
|
|
81 |
|
|
Short-term lease cost |
|
|
10 |
|
|
|
3 |
|
|
|
15 |
|
|
|
6 |
|
|
Total lease cost |
|
$ |
401 |
|
|
$ |
51 |
|
|
$ |
568 |
|
|
$ |
101 |
|
Operating lease costs during the six months ended September 30, 2021 and 2020 were included within cost of sales and selling, general and administrative expenses.
As of September 30, 2021, future minimum payments required under non-cancelable leases are:
|
|
|
Operating
Leases |
|
|
Finance
Leases |
|
|
Remainder of 2022 |
|
$ |
688 |
|
|
$ |
13 |
|
|
2023 |
|
|
1,325 |
|
|
|
26 |
|
|
2024 |
|
|
1,183 |
|
|
|
11 |
|
|
2025 |
|
|
1,164 |
|
|
|
— |
|
|
2026 |
|
|
1,169 |
|
|
|
— |
|
|
2027 and thereafter |
|
|
4,856 |
|
|
|
— |
|
|
Total lease payments |
|
|
10,385 |
|
|
|
50 |
|
|
|
|
|
|
|
|
|
|
|
|
Less – amount representing interest |
|
|
1,296 |
|
|
|
5 |
|
|
Present value of net minimum lease payments |
|
$ |
9,089 |
|
|
$ |
45 |
|
NOTE 15 – DEBT:
On June 1, 2021, the Company entered into a $20,000 five-year term loan with Bank of America. The term loan requires monthly principal payments of $167 through June 1, 2026, with the remaining principal amount plus all interest due on the maturity date. The interest rate on the term loan is the applicable Bloomberg Short-Term Bank Yield Index ("BSBY"), plus 1.50%, subject to a 0.00% floor. In addition, on June 1, 2021, the Company terminated its revolving credit facility agreement with JPMorgan Chase Bank, N.A. and entered into a revolving credit facility with Bank of America that provides a $30,000 line of credit, including letters of credit and bank guarantees, expandable at the Company’s option and the bank’s approval at any time up to $40,000. As of September 30, 2021, the Company had $4,000 outstanding on the line of credit. The agreement has a five-year term. Amounts outstanding under the facility agreement bear interest at a rate equal to BSBY plus 1.50%, subject to a 0.00% floor. As of September 30, 2021, the BSBY rate was 0.0558%. Outstanding letters of credit under the agreement are subject to a fee of 1.50% per annum of the outstanding undrawn amount of each letter of credit that is not secured by cash and 0.6% of each letter of credit that is secured by cash. The upfront fee for both the term loan and revolving credit facility was 0.20% of the committed facilities and amounts available for borrowing under the revolving credit facility are subject to an unused commitment fee of 0.25%. Under the term loan agreement and revolving credit facility, the Company covenants to maintain a maximum total leverage ratio, as defined in such agreements, of 3.0 to 1.0, which may be increased to 3.25 to 1.0 following an acquisition for a period of twelve months following the closing of the acquisition. In addition, the Company covenants to maintain a minimum fixed charge coverage ratio, as defined in such agreements, of 1.2 to 1.0 and minimum margined assets, as defined in such agreements, of 100% of total amounts outstanding on the revolving credit facility, including letters of credit.
On June, 1, 2021, the Company entered into an agreement to amend its letter of credit facility agreement with HSBC Bank USA, N.A. and decreased the Company’s line of credit from $15,000 to $7,500. Under the amended agreement, the Company incurs an annual facility fee of $5 and outstanding letters of credit are subject to a fee of between 0.75% and 0.85%, depending on the term of the letter of credit. Interest is payable on the principal amounts of unreimbursed letter of credit draws under the facility at a rate of 3% plus the bank’s prime rate. The agreement is subject to an annual renewal by the bank on July 31 of each year.
18
Letters of credit outstanding as of September 30, 2021 and March 31, 2021 were $8,133 and $11,567, respectively.
NOTE 16 – ACCOUNTING AND REPORTING CHANGES:
In the normal course of business, management evaluates all new accounting pronouncements issued by the Financial Accounting Standards Board ("FASB"), the Securities and Exchange Commission, the Emerging Issues Task Force, the American Institute of Certified Public Accountants or any other authoritative accounting body to determine the potential impact they may have on the Company's consolidated financial statements.
In December 2019, the FASB issued Accounting Standards Update ("ASU") No. 2019-12, “Simplifying the Accounting for Income Taxes.” The amended guidance simplifies the accounting for income taxes, eliminating certain exceptions to the general income tax principles, in an effort to reduce the cost and complexity of application. The amended guidance is effective for fiscal years beginning after December 15, 2020, including interim periods within those fiscal years. The guidance requires application on either a prospective, retrospective or modified retrospective basis, contingent on the income tax exception being applied. The Company adopted the new guidance, on a prospective basis, on April 1, 2021. The adoption of this ASU did not have a material impact on the Company’s consolidated financial statements.
Management does not expect any other recently issued accounting pronouncements, which have not already been adopted, to have a material impact on the Company's consolidated financial statements.
NOTE 17 – OTHER OPERATING INCOME, NET:
On August 9, 2021, the Company and James R. Lines entered into a Severance and Transition Agreement (the “Transaction Agreement”) pursuant to which Mr. Lines resigned from his position as the Company’s Chief Executive Officer and as a member of the Board of Directors, and from positions he holds with all Company subsidiaries and affiliates, effective as of the close of business on August 31, 2021. The Transition Agreement provides that for a period of 18 months following the separation date, Mr. Lines is paid his base salary as well as health care premiums. As a result, a liability was recorded in the amount of $798 in Accrued Compensation on the Company’s Condensed Consolidated Balance Sheets and recognized against Other operating income, net on the Condensed Consolidated Statements of Operations.
During the second quarter ended September 30, 2021, the Company terminated the earn out agreement related to the acquisition of BN (see Note 2), therefore the Company recognized a change in fair value of the contingent liability in the amount of $1,900, which was included in Other operating income, net on the Company’s Condensed Consolidated Statement of Operations.
NOTE 18: SUBSEQUENT EVENTS:
On October 26, 2021, the Company entered into a Performance Bonus Agreement (the “Bonus Agreement”) to provide certain employees of BN with performance-based awards considering the BN business results on a stand-alone basis. The purpose of the new bonus arrangement is to align a broader number of the BN leadership team with the achievement of BN performance objectives. The Bonus Agreement provides for payments to be made for certain performance-based results of BN for fiscal years ending March 31, 2024, 2025 and 2026.
19
Item 2.Management’s Discussion and Analysis of Financial Condition and Results of Operations
(Dollar and share amounts in thousands, except per share data)
Overview
We are a global business that designs, manufactures and sells critical equipment for the defense/space, energy/new energy and chemical/petrochemical industries. For the defense and space industry, our equipment is used in nuclear propulsion power systems, for undersea and space propulsion, power and energy management systems and for life support systems in space. Our energy and new energy markets include oil refining, cogeneration, and alternative power to produce hydrogen. For the chemical and petrochemical industries, our equipment is used in fertilizer, ethylene, methanol and downstream chemical facilities.
Our global brand is built upon engineering expertise and close customer collaboration to design, develop, and produce mission critical equipment and systems that enable our customers to meet their economic and operational objectives. Continual improvement of our processes and systems to ensure qualified and compliant equipment are hallmarks of our brand. Our early engagement with customers and support until the end of service life are values upon which our brand is built.
Our corporate headquarters are located in Batavia, New York. We have production facilities co-located with our headquarters in Batavia. We have a wholly-owned subsidiary, Barber-Nichols, LLC ("BN"), based in Arvada, Colorado, that designs, develops, manufactures and sells specialty turbomachinery products for the aerospace, cryogenic, defense and energy markets (see "Acquisition" below). We also have wholly-owned foreign subsidiaries, Graham Vacuum and Heat Transfer Technology (Suzhou) Co., Ltd. ("GVHTT"), located in Suzhou, China and Graham India Private Limited ("GIPL"), located in Ahmedabad, India. GVHTT provides sales and engineering support for us in the People's Republic of China and management oversight throughout Southeast Asia. GIPL serves as a sales and market development office focusing on the refining, petrochemical and fertilizer markets in India.
Our current fiscal year (which we refer to as "fiscal 2022") ends March 31, 2022.
Acquisition
We completed the acquisition of BN on June 1, 2021. BN was founded as a specialty turbomachinery engineering company in 1966. BN has grown rapidly from programs that involve complex production and systems integration. BN uses a combination of knowledge in rotating equipment, power generation cycles, and electrical management systems and has participated in the design and development of different power and propulsion systems used in underwater vehicles.
The acquisition of BN is expected to change the composition of the Company’s future end market mix. We expect approximately 45%-50% of our business for the last ten months of fiscal 2022, after the acquisition, to provide equipment to the U.S. Navy. We expect the energy market to be 35%-40% of sales and the aerospace and other markets to be 10%-15% of sales.
The BN transaction was accounted for as a business combination, which requires that assets acquired and liabilities assumed be recognized at their fair value as of the acquisition date. The purchase price of $72,014 was comprised of 610 shares of the Company’s common stock, representing a value of $8,964 at $14.69 per share, and cash consideration of $61,150, subject to certain potential adjustments, including a customary working capital adjustment. The cash consideration was funded through cash on-hand and debt proceeds (See Note 15 to the Condensed Consolidated Financial Statements included in Item 1 in this Quarterly Report on Form 10-Q). The purchase agreement with respect to the acquisition also included a contingent earn-out dependent upon certain financial measures of BN post-acquisition, pursuant to which the sellers were eligible to receive up to $14,000 in additional cash consideration. Subsequent to the acquisition, the earn out agreement was terminated. Acquisition related costs of $262 were expensed in the first half of fiscal 2022 and are included in Selling, general and administrative expenses for the six months ended September 30, 2021 in the Condensed Consolidated Statement of Operations.
Highlights
Highlights for the three months ended September 30, 2021 include:
|
|
• |
Net sales for the second quarter of fiscal 2022 were $34,146, up 22% compared with $27,954 for the second quarter of the fiscal year ended March 31, 2021 (which we refer to as "fiscal 2021"). Sales in the quarter include $16,486 related to the acquisition which more than offsets declines in the organic business. Net sales for the first six months of fiscal 2022 were $54,303, up 22% from $44,664 in the first six months of fiscal 2021. Sales in the first half of fiscal 2022 include $19,957 from the acquisition, more than offsetting a reduction of $9,948 in the organic business. |
|
|
• |
Net loss and loss per diluted share for the second quarter of fiscal 2022 were $492 and ($0.05), respectively, compared with net income and income per diluted share of $2,744 and $0.27, respectively, for the second quarter of fiscal 2021. |
20
|
|
|
Net loss and loss per diluted share for the first six months of fiscal 2022 were $3,618 and ($0.35), respectively, compared with net income of $926 and income per diluted share of $0.09 for the first six months of fiscal 2021. |
|
|
• |
Orders booked in the second quarter of fiscal 2022 were $31,386, compared with $34,974 of orders booked in the second quarter of fiscal 2021. Orders booked in the first six months of fiscal 2022 were $52,258, compared with the first six months of fiscal 2021 when orders booked were $46,442. For more information on this performance indicator see "Orders and Backlog" below. |
|
|
• |
Backlog was $233,247 at September 30, 2021, compared with $235,938 at June 30, 2021. For more information on this performance indicator see "Orders and Backlog" below. |
|
|
• |
Gross profit margin and operating margin for the second quarter of fiscal 2022 were 10% and (2%), respectively, compared with 28% and 12%, respectively, for the second quarter of fiscal 2021. Gross profit margin and operating margin for the first six months of fiscal 2022 were 8% and (9%), respectively, compared with 21% and 2%, respectively, for the first six months of fiscal 2022. |
|
|
• |
Cash and short-term investments at September 30, 2021 were $16,463, compared with $19,143 at June 30, 2021. |
Forward-Looking Statements
This report and other documents we file with the Securities and Exchange Commission include "forward-looking statements" within the meaning of Section 27A of the Securities Act of 1933, as amended, and Section 21E of the Securities Exchange Act of 1934, as amended.
These statements involve known and unknown risks, uncertainties and other factors that may cause actual results to be materially different from any future results implied by the forward-looking statements. Such factors include, but are not limited to, the risks and uncertainties identified by us under the heading "Risk Factors" in Item 1A of our Annual Report on Form 10-K for fiscal 2021 and included under Item 1A, "Risk Factors" in this Quarterly Report on Form 10-Q.
Forward-looking statements may also include, but are not limited to, statements about:
|
|
• |
the continuing impacts of, and risks caused by, the COVID-19 pandemic on our business operations, our customers and our markets; |
|
|
• |
the current and future economic environments, including the volatility associated with the COVID-19 pandemic, affecting us and the markets we serve; |
|
|
• |
the impact of potential government COVID-19 vaccine mandates on our ability to attract and retain employees and on our business and results of operations; |
|
|
• |
our ability to successfully integrate and operate BN; |
|
|
• |
expectations regarding investments in new projects by our customers; |
|
|
• |
sources of revenue and anticipated revenue, including the contribution from anticipated growth; |
|
|
• |
expectations regarding achievement of revenue and profitability; |
|
|
• |
plans for future products and services and for enhancements to existing products and services; |
|
|
• |
our operations in foreign countries, including among other things, the impact of nationalization in certain countries of suppliers for the markets we serve; |
|
|
• |
political instability in regions in which our customers are located; |
|
|
• |
tariffs and trade relations between the United States and its trading partners; |
|
|
• |
our ability to affect our growth and acquisition strategy; |
|
|
• |
our ability to maintain or expand work for the U.S. Navy; |
|
|
• |
our ability to maintain or expand work for the commercial space market; |
|
|
• |
our ability to successfully execute our existing contracts; |
|
|
• |
estimates regarding our liquidity and capital requirements; |
|
|
• |
timing of conversion of backlog to sales; |
|
|
• |
production preferences directed toward DX or DO related orders with priority ratings; |
|
|
• |
our ability to attract or retain customers; |
21
|
|
• |
the outcome of any existing or future litigation; and |
|
|
• |
our ability to increase our productivity and capacity. |
Forward-looking statements are usually accompanied by words such as "anticipate," "believe," "contemplate," "continue," "could," "estimate," "may," "might," "intend," "interest," "appear," "expect," "suggest," "plan," "predict," "project," "encourage," "potential," "should," "view," "will," and similar expressions. Actual results could differ materially from historical results or those implied by the forward-looking statements contained in this report.
Undue reliance should not be placed on our forward-looking statements. Except as required by law, we undertake no obligation to update or announce any revisions to forward-looking statements contained in this report, whether as a result of new information, future events or otherwise.
Current Market Conditions
Demand for our equipment and systems for the defense industry is expected to remain strong and continue to expand based on the planned procurement of submarines, aircraft carriers and undersea propulsion and power systems. Submarines, both Virginia and Columbia classes, and aircraft carriers are considered critical to national defense. We anticipate demand for our equipment and systems will continue to increase in the coming years. With the addition of revenue from the BN acquisition, consolidated revenue for sales to the U.S. Navy is projected to be $60 million to $70 million in fiscal 2022. In addition to U.S. Navy applications, we also provide specialty pumps, turbines, compressors and controllers for various fluid and thermal management systems used in DoD radar, laser, electronics and power systems. We have built a leading position, and in some instances, sole source position, for certain systems and equipment.
The energy and petrochemical markets have been impacted by demand disruption caused by the COVID-19 global pandemic. Western energy markets are further impacted by alternative energy growth with reduced reliance of fossil-based fuels. This, we believe, has caused our crude oil refining customers to reduce sustaining or MRO spending and dramatically scale back strategic growth investment. Our western energy and crude oil refining customers are not expected to return to previous levels of investment in the near term, though we are seeing some improvements compared with the second half of last year. Within our emerging or developing markets, we anticipate new capacity investment will occur over the next several years. These markets are expected to require additional local refining capacity to meet local demand for petroleum products.
We also believe that systemic changes in the energy markets are occurring and that such changes are being driven, in part, by the increasing use by consumers of alternative fuels in lieu of fossil fuels. As a result, we anticipate demand growth for fossil-based fuels will be less than the global GDP growth rate. Accordingly, we expect that crude oil refiners will focus new investments toward the installed base, and that inefficient refineries will close and new refining capacity will be co-located where fuels and petrochemicals are produced. We also anticipate that future investment by refiners in renewable fuels (e.g., renewable diesel), in existing refineries (e.g., to expand feedstock processing flexibility and to improve conversion of oil to refined products), to gain greater throughput, or to build new capacity (e.g., integrated refineries with petrochemical products capabilities) will continue to drive demand for our products and services.
We expect Asian investment in chemical/petrochemical new capacity will return during the next 12-18 months while our Western integrated energy companies with petrochemical production assets will continue to limit capital investment. The timing and catalyst for a recovery in our commercial markets (crude oil refining and chemical/petrochemical markets) remains uncertain. Accordingly, we believe that in the near term the quantity of projects available for us to compete for will be fewer and that the pricing environment will remain challenging.
The alternative and clean energy opportunities for our heat transfer, power production and fluid transfer systems are expected to continue to grow. We assist in designing, developing and producing equipment for hydrogen production, distribution and fueling systems, concentrated solar power and storage, and small modular nuclear systems. We believe that we are positioning the Company to be a more significant contributor as these markets continue to develop.
We believe in the near and medium-term that chemical and petrochemical capital investment will continue to decouple from energy investment. Over the long term, we expect that population growth, an expanding global middle class and an increasing desire for improved quality of life and access to consumer products will drive increased demand for industrial goods within the plastics and resins value chain along with fertilizers or related products. Consequently, when global economies return to stable growth, we expect investment in new global chemical and petrochemical capacity will resume and that such investments will in turn drive growth in demand for our products and services.
BN products and market access provide revenue and growth potential in the commercial space/aerospace markets. The commercial space market has grown and evolved rapidly, and BN has provided rocket engine turbo pump systems and components for
22
many of the launch providers. We expect that in the long term extended space exploration will become more prevalent, and we anticipate that our thermal/fluid management and environmental control and life support system turbomachinery will play important roles. BN is also participating in future aerospace power and propulsion system development through supply of fluid and thermal management systems components. Small power dense systems are imperative for these applications and we believe our technology and expertise will enable us to achieve sales in this market as well.
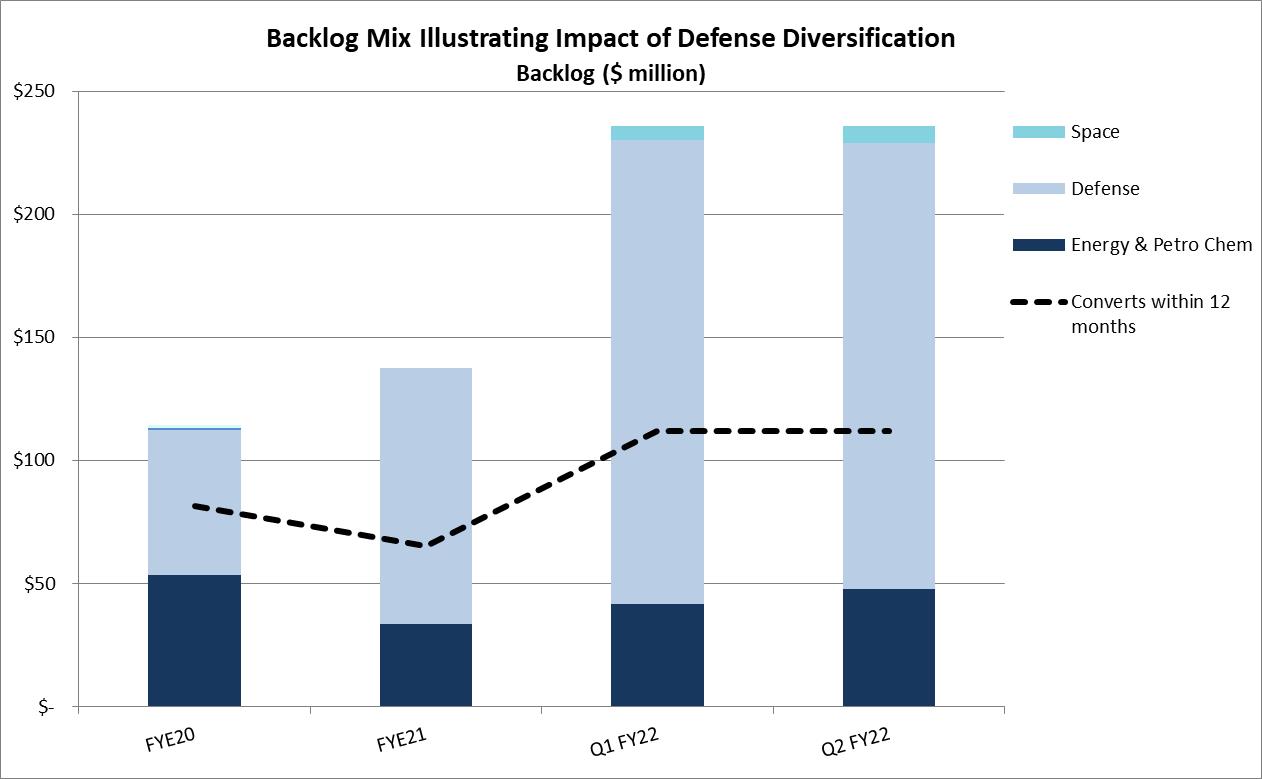 The chart below shows the successful strategy to transform the Company toward the defense market. The defense market comprised 78% of our total backlog at September 30, 2021. We believe this diversification is especially beneficial when our commercial markets are weak, as is presently the case.
*Note: FYE refers to fiscal year ended March 31
Results of Operations
To better understand the significant factors that influenced our performance during the periods presented, the following discussion should be read in conjunction with our Condensed Consolidated Financial Statements and the notes to our Condensed Consolidated Financial Statements included in Part I, Item 1, of this Quarterly Report on Form 10-Q.
23
The following table summarizes our results of operations for the periods indicated:
|
|
|
Three Months Ended |
|
|
Six Months Ended |
|
|
|
|
September 30, |
|
|
September 30, |
|
|
|
|
2021 |
|
|
2020 |
|
|
2021 |
|
|
2020 |
|
|
Net sales |
|
$ |
34,146 |
|
|
$ |
27,954 |
|
|
$ |
54,303 |
|
|
$ |
44,664 |
|
|
Gross profit |
|
$ |
3,443 |
|
|
$ |
7,693 |
|
|
$ |
4,357 |
|
|
$ |
9,261 |
|
|
Gross profit margin |
|
|
10 |
% |
|
|
28 |
% |
|
|
8 |
% |
|
|
21 |
% |
|
SG&A expenses (1) |
|
$ |
5,247 |
|
|
$ |
4,253 |
|
|
$ |
10,170 |
|
|
$ |
8,155 |
|
|
SG&A as a percent of sales |
|
|
15 |
% |
|
|
15 |
% |
|
|
19 |
% |
|
|
18 |
% |
|
Net loss |
|
$ |
(492 |
) |
|
$ |
2,744 |
|
|
$ |
(3,618 |
) |
|
$ |
926 |
|
|
Diluted loss per share |
|
$ |
(0.05 |
) |
|
$ |
0.27 |
|
|
$ |
(0.35 |
) |
|
$ |
0.09 |
|
|
Total assets |
|
$ |
191,836 |
|
|
$ |
144,622 |
|
|
$ |
191,836 |
|
|
$ |
144,622 |
|
|
Total assets excluding cash, cash equivalents and investments |
|
$ |
175,373 |
|
|
$ |
76,766 |
|
|
$ |
175,373 |
|
|
$ |
76,766 |
|
|
|
(1) |
Selling, general and administrative expenses are referred to as "SG&A". |
The Second Quarter and First Six Months of Fiscal 2022 Compared With the Second Quarter and First Six Months of Fiscal 2021
Sales for the second quarter of fiscal 2022 were $34,146, a 22% increase from sales of $27,954 for the second quarter of fiscal 2021. Sales from the acquisition in the quarter were $16,486. Our domestic sales, as a percentage of aggregate sales, were 77% in the second quarter of fiscal 2022 compared with 62% in the second quarter of fiscal 2021. Domestic sales increased $8,950 in the second quarter of fiscal 2022, or 52% year-over-year, due to the acquisition of BN, which helped to offset lower international refining sales. International sales decreased $2,758, or 26%, in the second quarter of fiscal 2022 compared with the second quarter of fiscal 2021. Sales in the three months ended September 30, 2021 were 58% for the defense (U.S. Navy) industry, 18% to the refining industry, 10% to the chemical and petrochemical industries, 4% to space, and 10% to other commercial and industrial applications. Sales in the three months ended September 30, 2020 were 34% for the defense (U.S. Navy) industry 37% to the refining industry, 19% to the chemical and petrochemical industries, and 10% to other commercial and industrial applications. Fluctuation in sales among markets, products and geographic locations varies, sometimes significantly, from quarter-to-quarter based on timing and magnitude of projects. See also "Current Market Conditions," above. For additional information on anticipated future sales and our markets, see "Orders and Backlog" below.
Sales for the first six months of fiscal 2022 were $54,303, an increase of $9,639, or 22% compared with $44,664 for the first six months of fiscal 2021. Sales from the acquisition in the six months of fiscal 2022 were $19,957. Our domestic sales, as a percentage of aggregate product sales, were 74% in the first six months of fiscal 2022 compared with 60% in the same period in fiscal 2021. Domestic sales increased $13,406, or 50%, while international sales decreased by $3,767, or 21%, each as compared with the same prior year period. International sales accounted for 26% and 40% of total sales for the first six months of fiscal 2022 and fiscal 2021, respectively. Sales in the six months ended September 30, 2021 were 49% for the defense industry (U.S. Navy), 20% to the refining industry, 15% to the chemical and petrochemical industries, 4% to space and 12% to other commercial and industrial applications. Sales in the six months ended September 30, 2020 were 29% for the defense (U.S. Navy) industry, 29% to the refining industry, 30% to the chemical and petrochemical industries, and 12% to other commercial and industrial applications
Gross profit margin and operating margin for the second quarter of fiscal 2022 were 10% and (2%), respectively, compared with 28% and 0%, respectively, for the second quarter of fiscal 2021. Gross profit for the second quarter of fiscal 2022 decreased compared with fiscal 2021, to $3,443 from $7,693. The gross profit margin reflected a fabrication order whose material content and related profit was recognized in previous periods. The prior-year period had benefitted from a large, one-time, material only order with a defense customer.
Gross profit margin for the first six months of fiscal 2022 was 8% compared with 21% for the first six months of fiscal 2021. Gross profit for the first six months of fiscal 2022 compared with the first six months of fiscal 2021, decreased to $4,357 from $9,261. Gross profit and margin were down compared with the prior-year period due to the same factors which impacted the quarter. The flow of lower margin defense projects through the Batavia operations was more heavily weighted to the first half of fiscal 2022 and are expected to be completed by the end of the fiscal year. As a result, we expect that gross profit margin in the second half of fiscal 2022 will be significantly higher than the first half of the year.
SG&A expenses as a percent of sales for both the three-month periods ended September 30, 2021 and 2020 was 15%. SG&A expenses in the second quarter of fiscal 2022 were $5,247, an increase of $994 compared with the second quarter of fiscal 2021 SG&A expenses of $4,253. The impact of intangible amortization, accounted for $274 or 27% of the increase. The remaining increase was
24
due to the addition of BN and organizational development costs. SG&A expenses in the first six months of fiscal 2022 were $10,170, an increase of $2,015, compared with SG&A expenses of $8,155 in the first six months of fiscal 2021. The increase was due to the addition of the BN business, including $365 of purchase accounting amortization.
Subsequent to the acquisition, we terminated the contingent earn out agreement included in the purchase agreement for the acquisition of BN. On October 26, 2021 the Company entered into a Performance Bonus Agreement (the “Bonus Agreement”) to provide certain employees of BN with performance-based awards considering the BN business results on a stand-alone basis. The purpose of the new bonus arrangement is to align a broader number of the BN leadership team with the achievement of BN performance objectives. This agreement will allow us to better retain key employees of BN through fiscal 2026. The bonus Agreement provides for payments to be made for certain performance-based results of BN for fiscal years ending March 31, 2024, 2025 and 2026. Since the earn out was terminated, the value of the earn out has been reduced to $0, from the $1,900 original value. This $1,900 gain was recorded in the second quarter of fiscal 2022 in Other operating income, net, on the Company’s Condensed Consolidated Statement of Operations. Additionally, we incurred $798 of costs related to the resignation of and Severance and Transition Agreement with our previous Chief Executive Officer.
Interest income for the three-month period and six-month period ended September 30, 2021 were $14 and $31, respectively, compared with $26 and $120, respectively, for the same periods ended September 30, 2020. The decrease in interest income was due to less cash and investments after the BN acquisition.
Interest expense for the three and six-month periods ended September 30, 2021 was $129 and $168, respectively, compared with $3 and $8, respectively, for the same periods ended September 30, 2020. The increase was due to the interest on the term and revolver debt which was entered into in conjunction with the BN acquisition.
Our effective tax rate for each of the three and six-month periods ended September 30, 2021 was 27% and 20%, respectively. The effective tax rate for the three and six-month periods ended September 30, 2020 was 22% and 30%, respectively.
Net loss and loss per diluted share for the second quarter of fiscal 2022 were $492 and $0.05, respectively, compared with net income and income per diluted share of $2,744 and $0.27, respectively, in the second quarter of fiscal 2021. Net loss and loss per diluted share for the first six months of fiscal 2022 were $3,618 and $0.35, respectively, compared with net income of $926 and income per diluted share of $0.09 for the first six months of fiscal 2021. Since we acquired the BN business, it has outperformed our revenue and profitability expectations.
Liquidity and Capital Resources
The following discussion should be read in conjunction with our Condensed Consolidated Balance Sheets and Statements of Cash Flows:
|
|
|
September 30, |
|
|
March 31, |
|
|
|
|
2021 |
|
|
2021 |
|
|
Cash and investments |
|
$ |
16,463 |
|
|
$ |
65,032 |
|
|
Working capital |
|
|
36,540 |
|
|
|
76,675 |
|
|
Working capital ratio(1) |
|
|
1.6 |
|
|
|
2.8 |
|
|
Working capital excluding cash and investments |
|
|
20,077 |
|
|
|
11,643 |
|
|
Working capital excluding cash and investments as a percent
of net sales(2) |
|
|
13.5 |
% |
|
|
11.9 |
% |
|
|
(1) |
Working capital ratio equals current assets divided by current liabilities. |
|
|
(2) |
Working capital excluding cash and investments as a percent of net sales is based upon trailing twelve month sales, including BN pre-acquisition sales. |
Net cash used by operating activities for the first six months of fiscal 2022 was $8,702 compared with $2,258 of cash used for the first six months of fiscal 2021. The increase in cash used was primarily due to operating earnings and changes in unbilled revenue, income taxes and accounts payable, partly offset by a decrease in inventory and increased customer deposits.
Dividend payments and capital expenditures in the first six months of fiscal 2022 were $2,353 and $1,227, respectively, compared with $2,195 and $797, respectively, for the first six months of fiscal 2021.
Capital expenditures for fiscal 2022 are expected to be approximately $3,000 to $3,500.
25
Cash and investments were $16,463 on September 30, 2021 compared with $19,143 on June 30, 2021, down $2,680, and $65,032, respectively, from March 31, 2021.
We invest net cash generated from operations in excess of cash held for near-term needs in short-term, or less than 365 days, certificates of deposit, money market accounts or U.S. government instruments, generally with maturity periods of up to 180 days. Approximately 70% of our cash and investments are held in the U.S. The remaining 30% is held by our China operations.
On June 1, 2021, we entered into a $20,000 five-year term loan with Bank of America. The term loan requires monthly principal payments of $167 through June 1, 2026, with the remaining principal amount plus all interest due on the maturity date. The interest rate on the term loan is the applicable Bloomberg Short-Term Bank Yield Index ("BSBY"), plus 1.50%, subject to a 0.00% floor. The BSBY rate at September 30, 2021 was 0.0558%. In addition, on June 1, 2021, we terminated our revolving credit facility agreement with JPMorgan Chase Bank, N.A. and entered into a revolving credit facility with Bank of America that provides a $30,000 line of credit, including letters of credit and bank guarantees, expandable at our option and the bank’s approval at any time up to $40,000. The agreement has a five-year term. Amounts outstanding under the facility agreement bear interest at a rate equal to BSBY plus 1.50% per annum of the outstanding undrawn amount of each letter of credit that is not secured by cash and 0.6% of each commercial letter of credit that is secured by cash, subject to a 0.00% floor. Outstanding letters of credit under the agreement are subject to a fee of 1.50%. The upfront fee for both the term loan and revolving credit facility was 0.20% of the committed facilities and amounts available for borrowing under the revolving credit facility are subject to an unused commitment fee of 0.25%. Under the term loan agreement and revolving credit facility, we covenant to maintain a maximum total leverage ratio, as defined in such agreements, of 3.0 to 1.0, which may be increased to 3.25 to 1.0 following an acquisition for a period of twelve months following the close of the acquisition. In addition, we covenant to maintain a minimum fixed charge coverage ratio, as defined in such agreements, of 1.2 to 1.0 and minimum margined assets, as defined in such agreements, of 100% of total amounts outstanding on the revolving credit facility, including letters of credit.
On June, 1, 2021, we entered into an agreement to amend and restate our letter of credit facility agreement with HSBC Bank USA, N.A. and decreased our line of credit from $15,000 to $7,500. Under the amended agreement, we incur an annual facility fee of $5 and outstanding letters of credit are subject to a fee of between 0.75% and 0.85%, depending on the term of the letter of credit. Interest is payable on the principal amounts of unreimbursed letter of credit draws under the facility at a rate of 3% plus the bank’s prime rate.
Letters of credit outstanding on September 30, 2021 and March 31, 2021 were $8,133 and $11,567, respectively. The outstanding letters of credit as of September 30, 2021 were issued by Bank of America, HSBC and residual items from our prior agreement with JP Morgan. There was $4,000 outstanding on our Bank of America revolving credit facilities at September 30, 2021. There was $2,500 outstanding on our facilities on June 30, 2021, other than letters of credit. Availability under the Bank of America and HSBC lines of credit on September 30, 2021 was $25,638. We believe that cash generated from operations, combined with our investments and available financing capacity under our credit facility, will be adequate to meet our cash needs for the immediate future and to support our growth strategies.
Orders and Backlog
Management uses orders and backlog as measures of our current and future business and financial performance. Orders for the three-month period ended September 30, 2021 were $31,386 compared with $34,974 for the same period of fiscal 2021, a decrease of $3,588. Orders represent written communications received from customers requesting us to supply products and/or services. Orders related to the acquisition were $15,844. Domestic orders were 80% of total orders, or $24,964, and international orders were 20% of total orders, or $6,422, in the second quarter of fiscal 2022 compared with the second quarter of fiscal 2021 when domestic orders were 46%, or $16,117, of total orders, and international orders were 54%, or $18,857, of total orders.
During the first six months of fiscal 2022, orders were $52,253, compared with $46,442 for the same period of fiscal 2021. Domestic orders were 77% of total orders, or $40,367, and international orders were 23% of total orders, or $11,886, in the first six months of fiscal 2022 compared with the same period of fiscal 2021 when domestic orders were 42%, or $19,349, of total orders, and international orders were 58%, or $27,093, of total orders.
Backlog was $233,247 at September 30, 2021, compared with $235,938 at June 30, 2021, a 1% decrease, and $137,567 at March 31, 2021. Backlog is defined as the total dollar value of orders received for which revenue has not yet been recognized. Approximately 45% to 50% of orders currently in our backlog are expected to be converted to sales within one year. The majority of the orders that are expected to convert beyond twelve months are for the defense industry, specifically the U.S. Navy. At September 30, 2021, 78% of our backlog was attributable to U.S. Navy projects, 11% for refinery project work, 4% for chemical and petrochemical projects, 3% for space projects and 4% for other industrial applications. At June 30, 2021, 80% of our backlog was attributable to U.S. Navy projects, 12% was for refinery project work, 3% for chemical and petrochemical projects, 2% for space projects and 3% for other industrial applications. At September 30, 2021, we had no projects on hold.
26
Outlook
Our defense business continues to be strong. With the acquisition of BN, 78% of our $233,247 backlog is in defense. While much of the defense backlog includes projects with order to shipment of up to five years, we are expecting 45% to 50% of our sales in fiscal 2022 to be from the defense market.
Near term opportunities in the global energy and petrochemical markets have slowed significantly due to the combined impact of the COVID-19 pandemic and the supply and demand imbalance. Although we do not know when the COVID-19 pandemic will end or when the supply imbalance will subside, we expect our energy markets to recover, however, not to historical levels.
We intend to continue to look for organic growth opportunities as well as acquisitions or other business combinations that we believe will allow us to expand our presence in both our existing and ancillary markets.
All of the below expectations are inclusive of BN for the ten-month period we will own it during the current fiscal year.
Our expectations for sales and profitability assume that we are able to operate our production facilities in Batavia, New York and Arvada, Colorado at or near "normal" (pre-COVID-19 pandemic) capacity throughout fiscal 2022. We project that approximately 45% to 50% of backlog will convert to sales over the next 12 months. We expect the remaining backlog will convert beyond fiscal 2022, which includes a combination of U.S. Navy orders that have a long conversion cycle (up to five years) as well as certain commercial orders, the conversion of which has been extended by our customers.
Revenue in fiscal 2022 is expected to be $130,000 to $140,000, inclusive of $45,000 to $48,000 related to BN for the ten-month period we will own the business in the current fiscal year. We expect to have approximately $2,700 of acquisition related purchase price accounting costs to be recognized in fiscal 2022, which will primarily be amortization of intangible assets. Approximately $1,600 will be charged to cost of goods sold and the remaining $1,100 to SG&A. Inclusive of the purchase accounting costs, we expect gross profit margins to be 17% to 18% of sales and SG&A to be 15% to 16% of sales. Our expected tax rate is 24% to 25%. Adjusted earnings before net interest expense, income taxes, depreciation and amortization for the combined business is expected to be approximately $7,000 to $8,0001.
Although cash flow was negative in the first two quarters of fiscal 2022, we expect positive cash flow from operations for the remaining six months of fiscal 2022.
Contingencies and Commitments
We have been named as a defendant in lawsuits alleging personal injury from exposure to asbestos allegedly contained in or accompanying our products. We are a co-defendant with numerous other defendants in these lawsuits and intend to vigorously defend ourselves against these claims. The claims in our current lawsuits are similar to those made in previous asbestos lawsuits that named us as a defendant. Such previous lawsuits either were dismissed when it was shown that we had not supplied products to the plaintiffs’ places of work, or were settled by us for immaterial amounts.
As of September 30, 2021, we are subject to the claims noted above, as well as other legal proceedings and potential claims that have arisen in the ordinary course of business. Although the outcome of the lawsuits, legal proceedings or potential claims to which we are or may become a party cannot be determined and an estimate of the reasonably possible loss or range of loss cannot be made for the majority of the claims, we do not believe that the outcomes, either individually or in the aggregate, will have a material adverse effect on our results of operations, financial position or cash flows.
Critical Accounting Policies, Estimates, and Judgments
Our unaudited condensed consolidated financial statements are based on the selection of accounting policies and the application of significant accounting estimates, some of which require management to make significant assumptions. We believe that the most critical accounting estimates used in the preparation of our condensed consolidated financial statements relate to labor hour and total cost estimates and establishment of operational milestones which are used to recognize revenue under the overtime recognition model, accounting for contingencies, under which we accrue a loss when it is probable that a liability has been incurred and the amount can be reasonably estimated, and accounting for pensions and other postretirement benefits. For further information, refer to Item 7
|
1 |
We have not reconciled non-GAAP forward-looking adjusted earnings before net interest expense, income taxes, depreciation and amortization for the combined business to its most directly comparable GAAP measure, as permitted by Item 10(e)(1)(i)(B) of Regulation S-K. Such reconciliation would require unreasonable efforts to estimate and quantify various necessary GAAP components largely because forecasting or predicting our future operating results is subject to many factors out of our control or not readily predictable. |
27
"Management's Discussion and Analysis of Financial Condition and Results of Operations" and Item 8 "Financial Statements and Supplementary Data" included in our Annual Report on Form 10-K for the year ended March 31, 2021.
Off Balance Sheet Arrangements
We did not have any off balance sheet arrangements as of September 30, 2021 or March 31, 2021, other than letters of credit.
Item 3. Quantitative and Qualitative Disclosures About Market Risk
The principal market risks (i.e., the risk of loss arising from market changes) to which we are exposed are foreign currency exchange rates, price risk, project cancellation risk and trade policy.
The assumptions applied in preparing the following qualitative and quantitative disclosures regarding foreign currency exchange rate, price risk and project cancellation risk are based upon volatility ranges experienced by us in relevant historical periods, our current knowledge of the marketplace, and our judgment of the probability of future volatility based upon the historical trends and economic conditions of the markets in which we operate.
Foreign Currency
International consolidated sales for the second quarter and first six months of fiscal 2022 were 23% and 26% of total sales, respectively, compared with 38% and 40% for the same periods of fiscal 2021, respectively. Operating in markets throughout the world exposes us to movements in currency exchange rates. Currency movements can affect sales in several ways, the foremost being our ability to compete for orders against foreign competitors that base their prices on relatively weaker currencies. Business lost due to competition for orders against competitors using a relatively weaker currency cannot be quantified. In addition, cash can be adversely impacted by the conversion of sales made by us in a foreign currency to U.S. dollars. In each of the first six months of fiscal 2022 and fiscal 2021, all sales by us and our wholly-owned subsidiaries, for which we were paid, were denominated in the local currency of the respective subsidiary (U.S. dollars, Chinese RMB or India INR).
We have limited exposure to foreign currency purchases. In each of the first six months of fiscal 2022 and fiscal 2021, our purchases in foreign currencies represented approximately 2% of the cost of products sold. At certain times, we may enter into forward foreign currency exchange agreements to hedge our exposure against potential unfavorable changes in foreign currency values on significant sales and purchase contracts negotiated in foreign currencies. Forward foreign currency exchange contracts were not used in the periods being reported in this Quarterly Report on Form 10-Q and as of September 30, 2021 and March 31, 2021, we held no forward foreign currency contracts.
Price Risk
Operating in a global marketplace requires us to compete with other global manufacturers which, in some instances, benefit from lower production costs and more favorable economic conditions. Although we believe that our customers differentiate our products on the basis of our manufacturing quality, responsive and flexible service, and engineering experience and excellence, among other things, such lower production costs and more favorable economic conditions mean that certain of our competitors are able to offer products similar to ours at lower prices. The cost of metals and other materials used in our products can experience significant volatility, and as such, can impact our ability to reflect this volatility in our pricing.
Project Cancellation and Project Continuation Risk
Open orders are reviewed continuously through communications with customers. If it becomes evident to us that a project is delayed well beyond its original shipment date, management will move the project into "placed on hold" (i.e. suspended) category. Furthermore, if a project is cancelled by our customer, it is removed from our backlog. We attempt to mitigate the risk of cancellation by structuring contracts with our customers to maximize the likelihood that progress payments made to us for individual projects cover the costs we have incurred. As a result, we do not believe we have a significant cash exposure to projects which may be cancelled. At September 30, 2021, we had no projects on hold.
Item 4.Controls and Procedures
Conclusion regarding the effectiveness of disclosure controls and procedures
Our President and Chief Executive Officer (principal executive officer) and Vice President - Finance & Administration and Chief Financial Officer (principal financial officer) each have evaluated the effectiveness of our disclosure controls and procedures (as
28
defined in Exchange Act Rules 13a-15(e) and 15d-15(e)) as of the end of the period covered by this Quarterly Report on Form 10-Q. Based on such evaluation, and as of such date, our President and Chief Executive Officer and Vice President - Finance & Administration and Chief Financial Officer concluded that our disclosure controls and procedures were effective in all material respects.
Changes in internal control over financial reporting
Other than the events discussed under the section entitled Barber-Nichols Acquisition below, there has been no change to our internal control over financial reporting during the quarter covered by this Quarterly Report on Form 10-Q that has materially affected, or that is reasonably likely to materially affect, our internal control over financial reporting. We have not experienced any material impact to our internal controls over financial reporting.
Barber-Nichols Acquisition
On June 1, 2021, we acquired Barber-Nichols, LLC, a privately-owned designer and manufacturer of turbomachinery products for the aerospace, cryogenic, defense and energy markets, located in Arvada, Colorado. For additional information regarding the acquisition, refer to Note 2 to the Condensed Consolidated Financial Statements included in Item 1 in this Quarterly Report on Form 10-Q and Management’s Discussion and Analysis of Financial Condition and Results of Operations included in Item 2 in this Quarterly Report on Form 10-Q. Based on the recent completion of this acquisition and, pursuant to the Securities and Exchange Commission’s guidance that an assessment of a recently acquired business may be omitted from the scope of an assessment for a period not to exceed one year form the date of acquisition, the scope of our assessment of the effectiveness of internal control over financial reporting as of the end of the period covered by this report does not include Barber-Nichols, LLC.
We are in the process of implementing our internal control structure over the Barber-Nichols, LLC acquisition and we expect that this effort will be completed during the fiscal year ending March 31, 2023.
PART 11 – OTHER INFORMATION
Item 1A.Risk Factors
Except as stated below, there have been no material changes from the risk factors previously disclosed in Part 1 – Item 1A of the Company’s Form 10-K for the fiscal year ended March 31, 2021.
Potential government imposed COVID-19 vaccine mandates could adversely affect our ability to attract and retain employees which could have a material adverse impact on our business and results of operations.
On September 9, 2021, President Biden directed the Department of Labor’s Occupational Safety and Health Administration ("OSHA") to issue an Emergency Temporary Standard requiring that all employers with at least 100 employees ensure that their employees are fully vaccinated for COVID-19 or require employees to obtain a negative COVID-19 test at least once a week. OSHA is drafting an emergency regulation to carry out this mandate, which is expected to take effect in the coming weeks, although the timeline remains uncertain. It is unclear, among other things, if the vaccine mandate will apply to all employees and how compliance will be documented. As a company with more than 100 employees, we may be required to mandate COVID-19 vaccination of our workforce or have our unvaccinated employees undergo required weekly COVID-19 testing.
In addition, rules were adopted requiring all federal employees to be fully vaccinated by November 22, 2021. Further, federal agencies are expected to require vaccinations for any employees or other personnel working under an agreement with an agency not covered by the mandate. This is expected to apply to federal contractors and subcontractors, such as us.
Any requirement to mandate COVID-19 vaccination of our workforce or require our unvaccinated employees to be tested weekly could result in employee attrition and difficulty securing future labor needs, and may have an adverse effect on our future revenues, costs, and results of operations.
If we fail to successfully integrate the operations of Barber-Nichols, LLC, our financial condition and results of operations could be adversely affected.
On June 1, 2021, we acquired Barber-Nichols, LLC, which provides products to the aerospace, cryogenic and defense and energy markets. We cannot provide any assurances that we will be able to integrate the operations of Barber-Nichols, LLC without encountering difficulties, including unanticipated costs, difficulty in retaining customers and supplier or other relationships, failure to retain key employees, diversion of management’s attention, failure to integrate our information and accounting systems or establish and maintain proper internal control over financial reporting, any of which would harm our business and results of operations.
29
Furthermore, we may not realize the revenue and net income that we expect to achieve or that would justify our investment in Barber-Nichols, LLC, and we may incur costs in excess of what we anticipate. To effectively manage our expected future growth, we must continue to successfully manage our integration of Barber-Nichols, LLC and continue to improve our operational systems, internal procedures, accounts receivable and management, financial and operational controls. If we fail in any of these areas, our business and results of operations could be harmed.
Our acquisition of Barber-Nichols, LLC might subject us to unknown and unforeseen liabilities.
Barber-Nichols, LLC may have unknown and unforeseen liabilities, including, but not limited to, product liability, workers’ compensation liability, tax liability and liability for improper business practices. Although we are entitled to indemnification from the seller of Barber-Nichols, LLC for these and other matters, we could experience difficulty enforcing those obligations or we could incur material liabilities for the past activities of Barber-Nichols, LLC. Such liabilities and related legal or other costs could harm our business or results of operations.
Item 5.Other Information
Termination of Earn Out Agreement
In connection with the BN acquisition, the Company entered into an earn out agreement with the sellers which provided for a contingent earn out dependent upon certain financial measures of BN post-acquisition, in which the sellers were eligible to receive up to $14,000 in additional cash consideration. At June 30, 2021, a liability of $1,900 was recorded for the contingent earn out. Pursuant to the Termination Agreement (the "Termination Agreement"), the earn out agreement was terminated and the contingent liability was reversed into Other operating income, net on the Company’s Condensed Consolidated Statement of Operations. The foregoing description of the Termination Agreement does not purport to be complete and is qualified in its entirety by reference to the Termination Agreement which is filed as Exhibit 10.1 to this Quarterly Report on Form 10-Q and is incorporated herein by reference.
Adoption of Performance Bonus Agreement
As of October 26, 2021, the Company entered into a Performance Bonus Agreement (the "Bonus Agreement") to provide certain employees of BN with performance-based awards considering the BN business results on a stand-alone basis. The purpose of the new bonus arrangement is to align a broader number of the BN leadership team with the achievement of BN performance objectives. The Bonus Agreement provides for payments to be made for certain performance-based results of BN for fiscal years ending March 31, 2024, 2025 and 2026.
30
Item 6.Exhibits
INDEX OF EXHIBITS
|
|
|
|
|
|
|
|
|
|
|
|
(104) |
|
|
Cover Page Interactive Data File embedded within the Inline XBRL document
|
|
|
|
|
|
|
|
|
|
+
# |
Exhibit filed with this report
Management contract or compensation plan |
31
SIGNATURES
Pursuant to the requirements of the Securities Exchange Act of 1934, the registrant has duly caused this report to be signed on its behalf by the undersigned thereunto duly authorized.
|
|
|
|
|
|
GRAHAM CORPORATION
|
|
By: |
|
|
/s/ Jeffrey Glajch |
|
|
|
|
Jeffrey Glajch |
|
|
|
|
Vice President-Finance & Administration and |
|
|
|
|
Chief Financial Officer |
|
|
|
|
(On behalf of the Registrant and as Principal Financial Officer) |
Date: October 29, 2021
32